Edit→Remove All Displays and Data menu item
or the  icon in the toolbar to clear them out.
- In the
Fieldspanel open the3D gridnode andDerivednode, scroll down theDerivednode and selectPotential Temperature IsoSurface. - In the
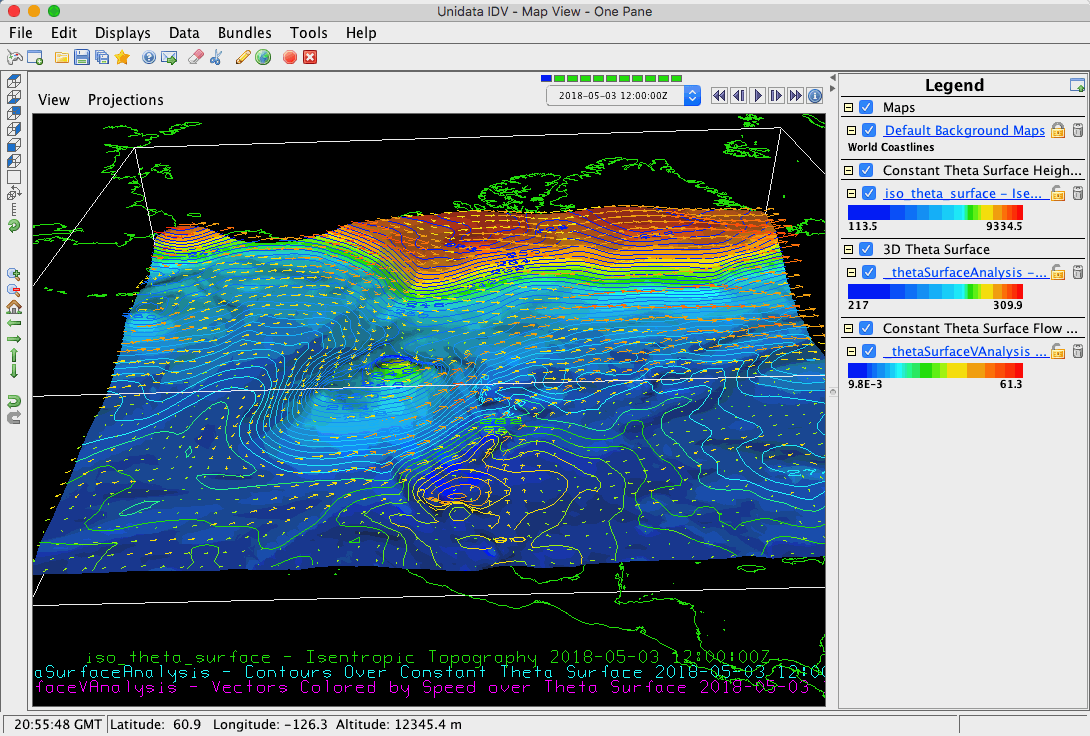
DisplaysopenConstant Theta Surface Height Plan Viewnode, and selectIsentropic Topographyand pressCreate Display - A dialog will pop up to allow you to set the isosurface value. The default isosurface value is 310 (default).
Click the
OKbutton to create the display. - After creating the display you can adjust the data range for the selecting color table.
- In the
Fieldspanel open the3D gridnode andDerivednode, scroll down theDerivednode and selectPotential Temperature IsoSurface Scalar Analysis. - In the
Displaysopen3D Theta Surfacenode, and selectContours Over Constant Theta Surfaceand pressCreate Display - Set the input of the isosurface value to 310.5.
- After you click the
Okbutton, a dialog will pop up to allow you to select theParameterfield. From the dialog, expand the3D gridnode and select theTemperature@Isobaric surfacefield and click theOKbutton. - After creating the display you can adjust the contour interval and apply the smoothing to the resulting display.
- In the
Fieldspanel open the3D gridnode andDerivednode, scroll down theDerivednode and selectPotential Temperature IsoSurface Vector Analysis. - In the
DisplaysopenConstant Theta Surface Flow Displaysnode, and selectVectors Colored by Speed over Theta Surfaceand pressCreate Display - Set the input of the isosurface value to 310.5.
- After you click the
Okbutton, a dialog will pop up to allow you to select thevoctorfield. From the dialog, expand the3D gridnode and theDerivednode and select theTrue Wind vectorsfield and click theOKbutton. - After creating the display you can set the skip value to adjust the density of the resulting display.
 |


