Edit→Remove All Displays menu to remove the displays
created in the previous exercise.Fields panel, expand
the 2D grid tab.
Select the mean sea level pressure (ETA model reduction)
field.Displays panel, select
Color-Shaded Plan View. Expand the
Probes tab, then, hold the
Ctrl key down and click on
Data Probe/Time Series to select both. Click
the Create Display button.
Once the displays are created, you can minimize the
control window for the color shaded display.- Use the rubber band zooming feature (Shift+Mouse drag) on the main view window to zoom in over the central United States (centered on Kansas). The blocky pattern you see shows the outline of each grid cell.
- Bring up the Control Window for the color shaded display
and click the
Shade Colorscheck box. Notice how the pattern changes. Return to the blocky pattern by unchecking theShade Colorscheckbox. - From the Probe Control window, right click on the
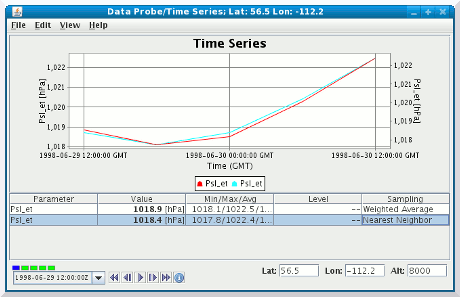
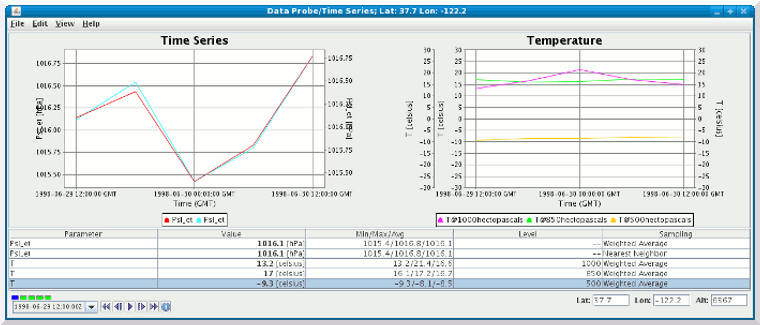
Psl_etline and select theParameter: Psl_et→Copymenu.
You will now have two entries for this field in
the Probe control.
Sampling column and
selecting that option from the dropdown list.


