

Unidata IDV Workshop for version 5.7 > Accessing and Displaying Data > NOAA Profiler Network Winds

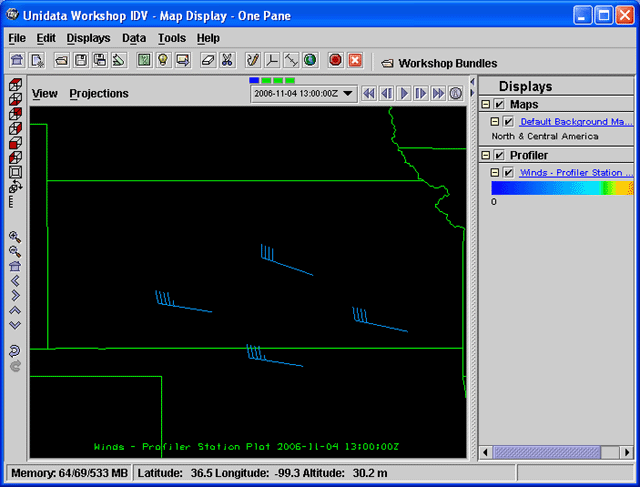
3.12.2 Profiler Station Plot Displays
The Profiler Station Plot shows winds at one level in the atmosphere,
above one or more stations.
Winds are shown with the meteorological wind barb symbol.
This is a 3D display and the
data appears in the correct elevation in the upper atmosphere.
If necessary, select Profiler data and times as described in
Loading Profiler Data.
- In the
Field Selector window create a
Profiler Station Plot display using
the Profiler winds field.
- Working with the Profiler Station Plot
- Use the control's Plan level (m MSL) box to change the level
to 12000 meters.
- Use the control's
Windbarb size box to enlarge
the size to a size you like.
- Rotate, and zoom out or in, to see the wind barbs at altitude in the 3D
display.
Set the viewpoint so you have a good view of the upper level winds
from all four stations.
- Start time animation, then stop animation.
- Remove All Displays
- If other displays are in the main IDV window, select the
menu item or the
 icon in the toolbar to clear them out.


Unidata IDV Workshop for version 5.7 > Accessing and Displaying Data > NOAA Profiler Network Winds

 icon in the toolbar to clear them out.


