

Unidata IDV Workshop for version 5.7 > Accessing and Displaying Data > Upper Air Displays

3.8.0 Sounding Displays
Upper Air RAOB sounding data can be accessed and displayed in the IDV as
skew-T log-p, Stuve or Emagram displays, with a table of
aerological values. More than one station and more than one sounding
at each station can be loaded at once.
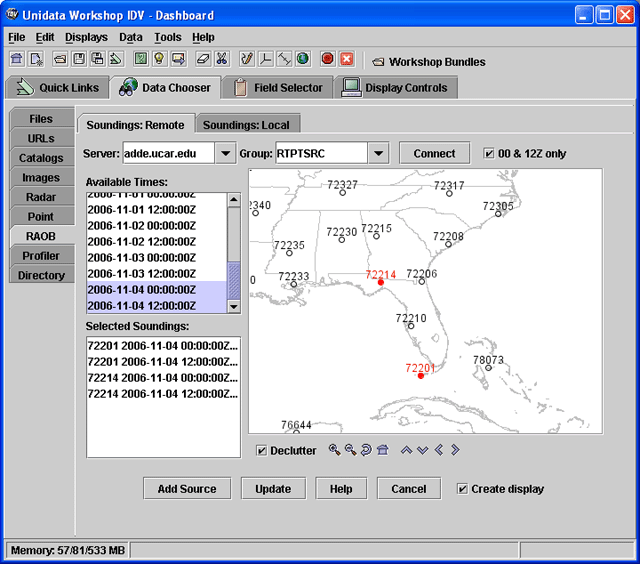
- Open the RAOB Data Source Chooser and Select a Time
- Open the
Data Choosers. 
- In the
Data Chooser tree click on the
RAOB node.
- Click on the
Soundings: Remote tab.
- In the
Server: entry box, select the remote ADDE server
adde.ucar.edu.
Group: entry box, select RTPTSRC. Make
sure the 00 & 12Z only box is checked
- Click on
Connect.
- The IDV will connect to the ADDE server at adde.ucar.edu and
download metadata about available RAOB data. Data times you can get
from this server are listed in the box
Available Times:.
- Select the 00 and 12 times for today.
- Zooming and Decluttering the Selector, and Selecting Stations
- The map only shows a few stations, so you need to zoom in
and declutter.
 More stations will appear when you zoom in and declutter.
Find station 72201 (Key West) southwest of Miami, Florida.
- Click on that station. It will turn red,
and it will be listed with the data times in the
Selected Soundings: box.
- Select another station, 72214, north of 72201, by holding down the
Ctrl key and clicking on 72214. Both stations now should be red.
- Four entries should be in the
Selected Soundings: box.
Click the Add Source
button at the bottom of the selector window.
You should see the label RAOB data: adde.ucar.edu in the
Data Sources panel in the Field Selector.
If the Create display checkbox was selected in the
chooser, the data will be read from the server and a
Skew-T display will be created. If not then
create it:
- In the
Field Selector window create a
RAOB Skew-T display using
the RAOB Data field.
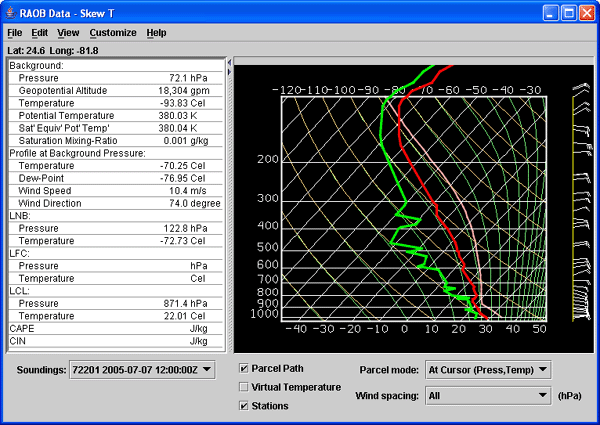
The skew-T plot appears in its own control window in the
Dashboard, with the data
from the first station and time plotted.
Skew-T plots of RAOB data have a station selector box
labeled Soundings. Undock the
Skew-T control from the Dashboard with the
menu.
Using the Skew-T Control
- The skew-T plot, wind barb staff, and associated aerological
table are all in the control window.
- Move the mouse pointer over the skew-T Plot and see the values
on the plot listed in the table.
- Use the
Soundings selector box to
change station and time selection.
- Use the menu item
to change the display to a Stuve.
- Show the idealized parcel path by checking the
Parcel Path checkbox. Change the
Parcel mode: to the
At Cursor Pressure option. Click in the
display with the middle mouse button to show the parcel
path from that pressure.
- Modify the sounding by clicking and dragging on the temperature
profile. Change the
Parcel mode: to the
At Cursor (Press,Temp) option. Click in the
display with the middle mouse button to show the parcel
from new locations on the modified sounding. For more information,
see
Using the IDV Sounding Displays
- Reset the profile with the
menu.


Unidata IDV Workshop for version 5.7 > Accessing and Displaying Data > Upper Air Displays

 More stations will appear when you zoom in and declutter.
Find station 72201 (Key West) southwest of Miami, Florida.


