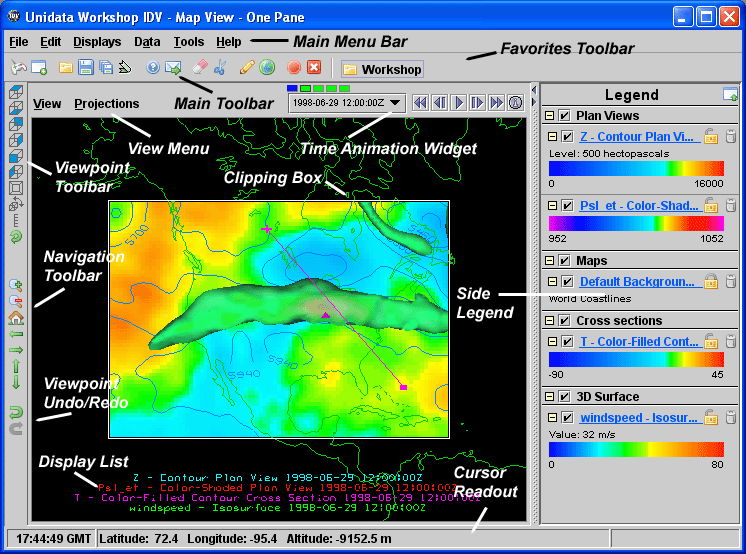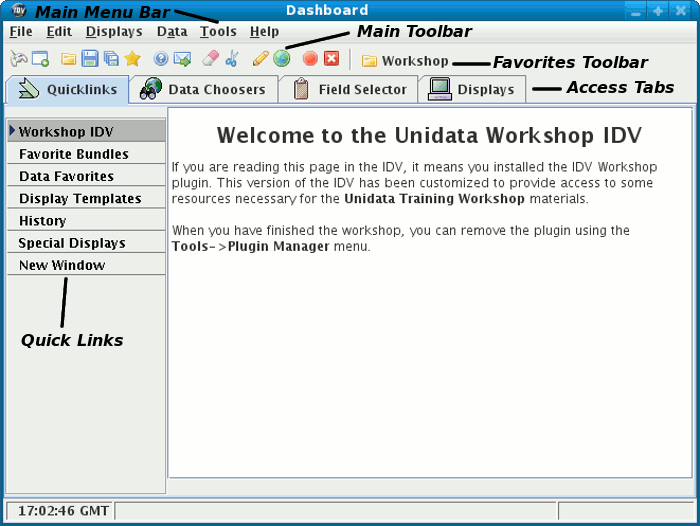


The sections below describe the user interface of the main window of the IDV reference application. First, we'll load in a time sequence of data so we can use some of the menus and widgets in the IDV's GUI and see their effect.
Favorites Toolbar, select the
Sample Data Displays item from the
Workshop menu.
OK button.
View Window is where
the visualizations of the loaded data are displayed. You can have
several of these windows as we'll see in a later exercise.

Dashboard window holds many of
the non "View" windows. It provides a holder for the data choosers,
field selector and the display controls as well as quick access
to some handy IDV features.

Dashboard and
View windows have
identical menu bars. This allows you to control the IDV from
either window.
Now let's learn how to navigate around the 3D main window.