

 Unidata's Integrated Data Viewer > Appendix > Examples of Display Types

8.0.4 Soundings
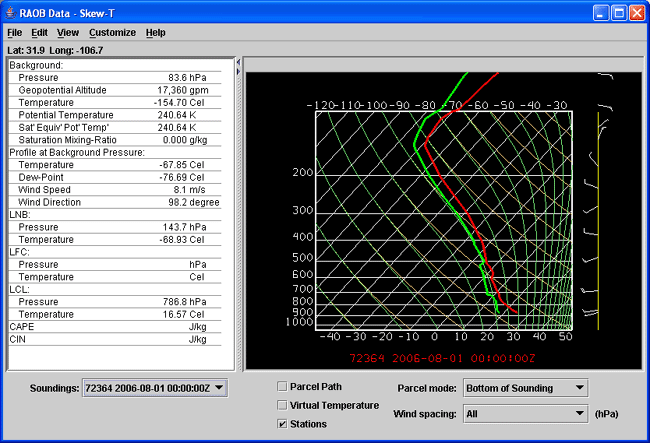
The meteorological sounding display is available with a choice
of thermodynamic diagrams (skew-T, Stuve and Emagram), with a
table of related aerological parameters.
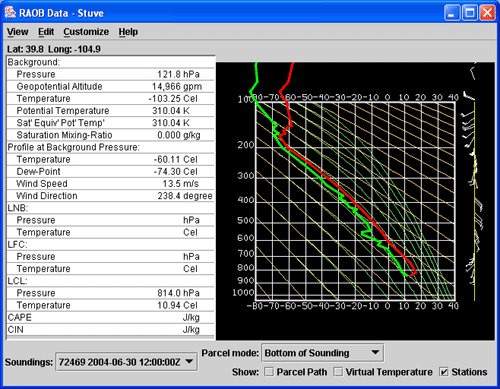
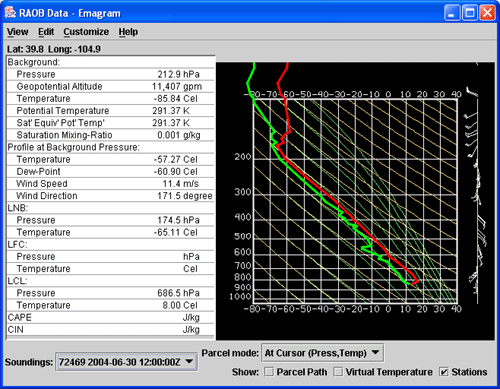
 Image 2: Stuve display Image 2: Stuve display |  Image 3: Emagram display Image 3: Emagram display |
A sounding diagram can be made for any point inside a data grid
of numerical weather prediction model output with temperature and
humidity (the dew-point temperature is computed by Unidata code from
temperature and relative humidity grids), or from balloon soundings
(RAOBs). The sounding display and its table and controls appear in a
separate window. To learn more about the aerological displays see the Sounding Display.


 Unidata's Integrated Data Viewer > Appendix > Examples of Display Types


