


This section describes how to make plots from the cross boundary subset of a cyclic rectilinear grid data.
The set of steps involve:
Edit→Remove All Displays and Data menu item
or the  icon in the toolbar to clear them out.
Data Choosers window.Catalogs node in the chooser tree.https://thredds.ucar.edu/thredds/catalog.xml
Update button. (Cut and Paste tip
 )
)
A tree view of the data catalog will be displayed in the window below the selector.
Realtime data from IDD
tab, and then the Forecast Model Data tab.GFS One Degree - Global Coverage
entry. Data Source Type drop down menu and then press
the Add Source button.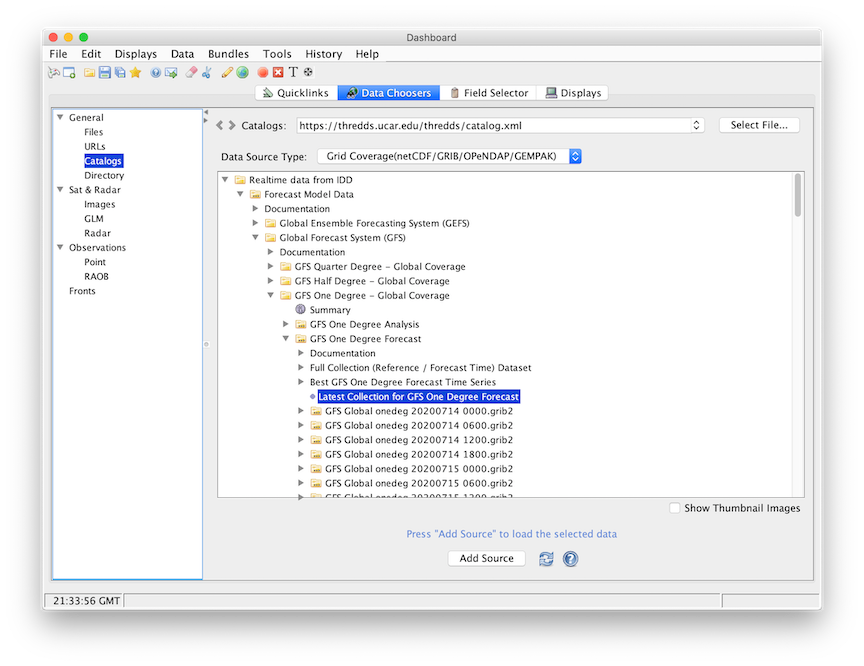
Spatial Subset tab of
the Data Source Properties or the Field Selector. The Flip map longitude button
at the bottom of the panel flips longitudes of a cyclic rectilinear grid from
0/360 to -180/180 (or vice-versa) before performing the cross seam subsetting. 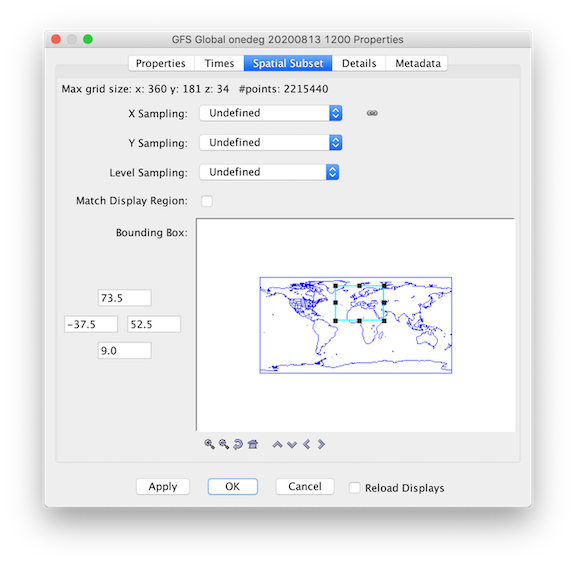
 )
to expand that category list. Select a parameter named "Speed (from u-component_of_wind_isobaric &
u-component_of_wind_isobaric)".
)
to expand that category list. Select a parameter named "Speed (from u-component_of_wind_isobaric &
u-component_of_wind_isobaric)". 
Data Source Properties
page of this User's Guide.