Overview
A number of the display controls make use of a charting facility. The charts
have a common set of properties and facilities.
Each of these display controls will show a thumbnail image of their charts
in the legend. This can be toggled using the View->Chart->Show Chart Thumbnail menu.There are three levels of configuration available to the user.
5.8.0 Chart Line Properties
At the lowest level you can set the properties of how each parameter or
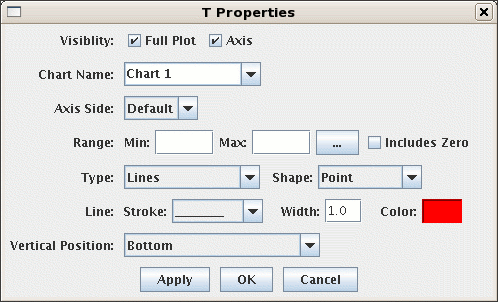
field is shown. This is done through the Chart Line properties dialog which
is brought up typically through the View->Chart menu or by right clicking
on the fields table.

Full Plot)
as well as the whether the axis label is shown. You can also specify a different Chart Name
by selecting one from the pull-down list or typing one into the field.
This is how you create new charts. The display will automatically create a new chart with the given name.
You can also specify what side of the chart the axis is shown. The
Range fields allow you to fix the axis range. That way as the chart values change the axis
range is maintained constant.
There are a number of settings for the actual display of the line. It can be a line, area, shape, etc.
You can also set the line stroke, width and color.
The Vertical Position menu allows you to define where in the chart special shapes
are shown (e.g., wind barbs, cloud coverage, text).5.8.1 Chart Properties
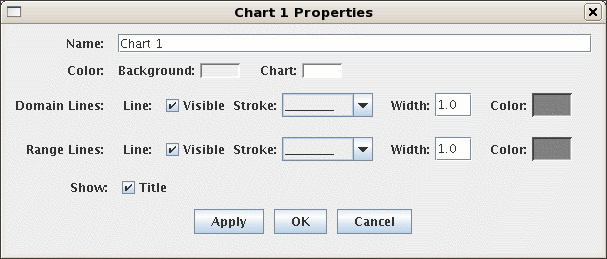
For each chart there are a number of settings that can be changed through the
Chart Properties dialog. This is also accessed through the View->Chart
menu or by right clicking on the chart.

- Control-R: Reset any zooming.
- Up/Down/Left/Right Arrows: Pan p
- Left mouse drag - zoom
5.8.2 Chart Layout
When you have multiple charts you can define different layouts for them
using the View->Chart->Layout menu. There are a number of
pre-defined layouts: Vertical, Horizontal, 2 Column, 3 Column, Tabs.
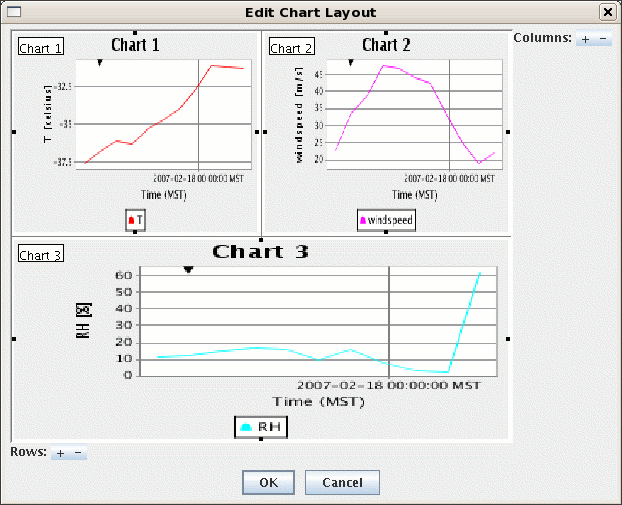
The Grid Layout allows for much flexibility in how the charts are organized
and laid out. The View->Chart->Layout->Change Grid Layout menu
brings up the Grid Layout Editor:


