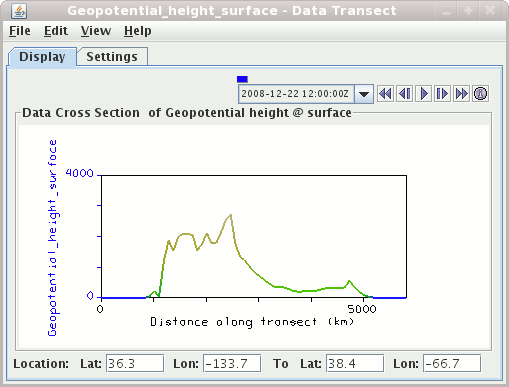
The control window consists of two tabs. The first shows the the profile of the data along the transect:


- Time Animation Control

controls looping of displays when more than one data time is loaded. See more in Time Animation Control. - Color Table
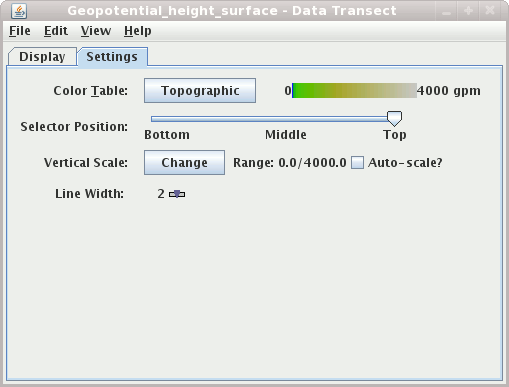
The control has a color bar showing the active color table and the associated high and low data values in the units the display is made in. As the mouse pointer is moved over the color bar, the value at a particular color is shown. Click on the color bar to start the Color Table Editor. Or click on the button that displays the name of the color table to show a popup menu that allows you to change the range, select other color tables, etc.
- Vertical Position
This slider allows you to set the vertical position of the data transect line.
- Autoscale Y-Axis
When selected, the display will automatically scale the Y Axis to the data range along the selector line.


