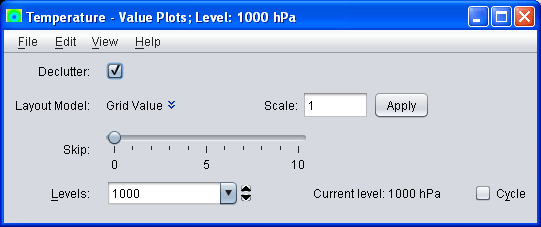
- Declutter
Click on the
Decluttercheckbox to see all grid point values. The display otherwise shows only selected point that do not overlap. When decluttering is turned on then, as you navigate through the display (e.g., through zooming) then the decluttering will be progressively applied. - Layout Model
The
Layout Modelallows you to configure how each point is plotted. The default model shows the value and a plus (+) at the grid point location. Click on the down arrows next to the layout model name to select a different model. You can change the station model (plot layout), and create new station models, with the Layout Model Editor - Scale
You can scale up or down the size of the displayed elements with this field.
- Skip
Adjust the Skip slider to change the resolution of the grid, skipping every N grid points in the x and y direction. This can be used in conjuction with the
Densitycheckbox to control the spacing of the plotted values. - Levels
Click on the
Levelsbox to see a pull down menu of the native grid levels. Click on one level value to reset the plan to that level. The plan level in use is shown in the data's native altitude units. TheLevelsbox is editable. Click in the box, enter a value and hit return to set your own value.Click on the
Cyclecheck box to animate vertically through all available levels.


