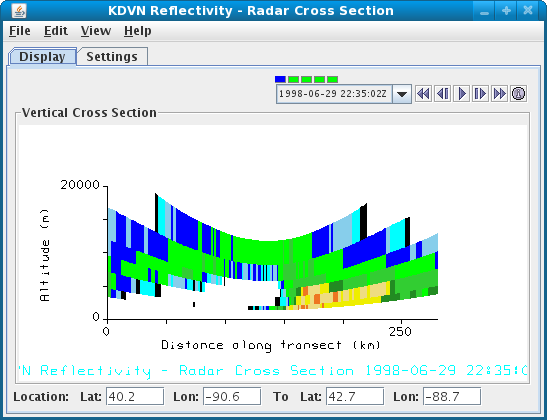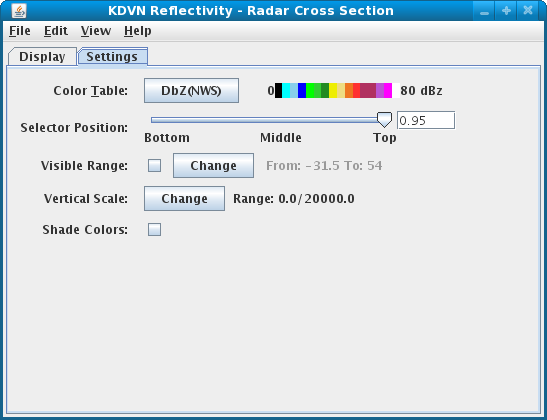

- Location
This shows the location of the end points of the cross section.
- Color Table
The control has a color bar showing the active color table and the associated high and low data values in the units the display is made in. As the mouse pointer is moved over the color bar, the value at a particular color is shown. Click on the color bar to start the Color Table Editor. Or click on the button that displays the name of the color table to show a popup menu that allows you to change the range, select other color tables, etc.
- Selector Position
You can change the vertical position of the selector line.
- Visible Range
In the Color Shaded Cross Section View the
Visible Rangeallows you to set the range that determines what parts of the data is actually shown. - Vertical Scale
You can change the vertical scale of the 2D cross section view. The Auto-scale checkbox, when checked, will scale the Y-AXis of cross section to the sampled data range.
- Shade Colors
If checked on blends colors between the radar data bins. The shaded display usually is not preferred for radar displays.
- Display
Use left-mouse button drag on the colored squares on the positioning line in the main view window to reposition the cross section.


