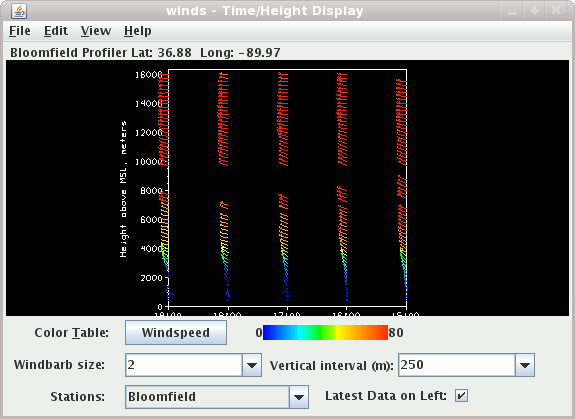
Image 1: Time/Height Display
The map position of the vertical profile is indicated by the "Lat: Long:" readout above the graph. The time and height values on the plot can be sampled by dragging the middle mouse button over the plot.
- Color Table
The control has a color bar showing the active color table and the associated high and low data values in the units the display is made in. As the mouse pointer is moved over the color bar, the value at a particular color is shown. Click on the color bar to start the Color Table Editor. Or click on the button that displays the name of the color table to show a popup menu that allows you to change the range, select other color tables, etc.
- Windbarb size
Use the
Windbarb sizebox to enlarge or reduce the wind barbs. - Vertical interval
Use the
Vertical intervalbox to change the vertical separation between wind barbs. - Stations
If more than one station was selected in the data selection, the Stations box appears with a list of all stations selected. Use it to switch between stations displayed.
- Latest data on left
The Latest data on left checkbox is used to change the order of times displayed. When checked, the most recent data time is on the left; and the oldest on the right.


