Edit→Remove All Displays and Data menu item
or the  icon in the toolbar to clear them out.
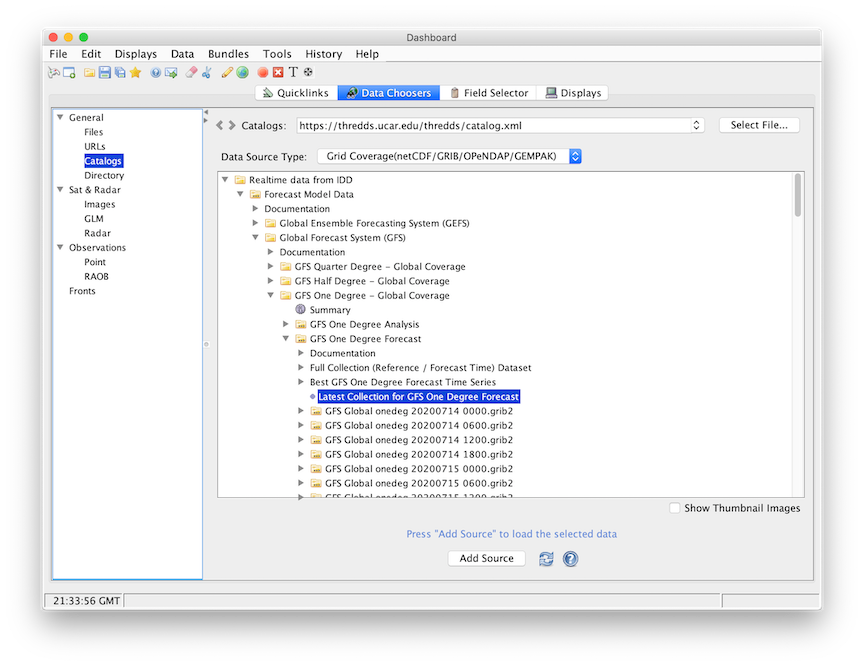
- Open the
Data Chooserswindow. - Click on the
Catalogsnode in the chooser tree. - From the catalog selector drop-down, select the Thredds data server
catalog:
https://thredds.ucar.edu/thredds/catalog.xml
Updatebutton. (Cut and Paste tip )
)
A tree view of the data catalog will be displayed in the window below the selector.
- Expand the
Realtime data from IDDtab, and then theForecast Model Datatab. - Select the latest collection for
GFS One Degree - Global Coverageentry. - Specify the data source type to be Grid Coverage(netCDF/GRIB/OPENDAP/GEMPAK)
using the
Data Source Typedrop down menu and then press theAdd Sourcebutton.

- The IDV defualts the type of model data as "Grid files" type. Only the "Grid Coverage" type has the feature of cross seam spatial subset.
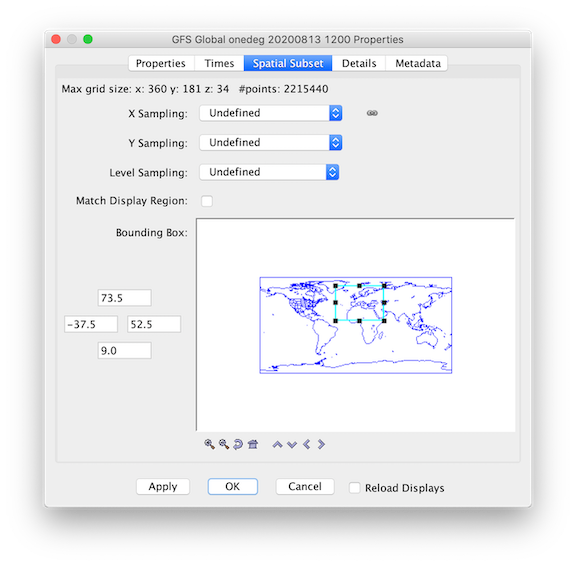
- Spatially subset the grid on the
Spatial Subsettab of the Data Source Properties or the Field Selector. TheFlip map longitudebutton at the bottom of the panel flips longitudes of a cyclic rectilinear grid from 0/360 to -180/180 (or vice-versa) before performing the cross seam subsetting.

- In the Fields panel of data parameters that are categorized as 2D and 3D fields,
Click on the 3D grid tab (
 )
to expand that category list. Select a parameter named "Speed (from u-component_of_wind_isobaric &
u-component_of_wind_isobaric)".
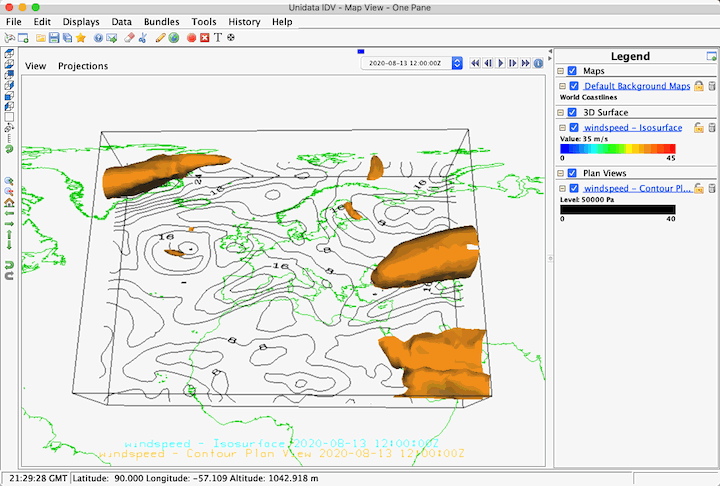
 - Select "Isosurface" display in the 3D Surface Displays list and click on the Create Display button. Create another Contour Plan View display by selecting that display in the Plan Views Displays list and click on the Create Display button. Both displays are created and shown in the main window.
- For more information on time and spatial subset, see the
Data Source Propertiespage of this User's Guide.


