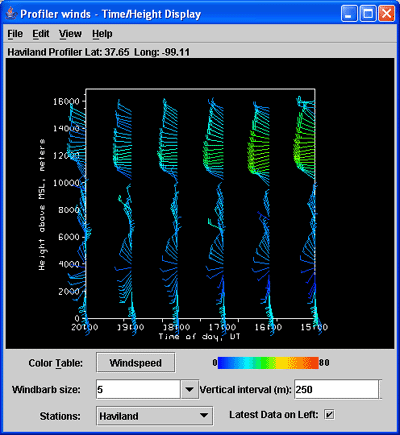
Field Selector window create a
Time/Height Display using
the Profiler winds field.The Profiler Time-Height display and control appears in a new window.

- Enlarge the display by dragging the edges of the window border with the mouse.
- Use the
Windbarb sizebox to enlarge the wind barbs size to 7. - Use the
Vertical intervalentry box to change the vertical separation between wind barbs to 500 meters. - Click on the
Color Tablebutton to get a menu of named color tables supplied in the IDV. Change color table to Basic->Bright 38. - The
Stationsbox appears with a list of all stations selected. Use it to switch between stations displayed. View all the stations' plots. - The checkbox
Latest data on leftis used to change the ordering of times displayed on the x axis.
- If other displays are in the main IDV window, select the
Edit→Remove All Displaysmenu item or the icon in the toolbar to clear them out.


