- Open the
Data Choosers.
- In the
Data Choosertree click on thePointnode. - Click on the
Upper Airtab. - In the
Server:entry box, select the remote ADDE serveradde.ucar.edu. In theData Type:entry box, select theUpper Air Dataentry. - Click on
Connect. - The IDV will connect to the ADDE server at adde.ucar.edu and
download metadata about available RAOB data. You can load data
in by relative times, or by absolute times. Select the
Relative timesradio button and the4 most recenttimes option. - From the
Levellist, select500for the 500 millibar level. - Click the
Add Sourcebutton.
Create display option was checked in
the chooser, a Point Data Plot will automatically
be created. If not, create one.
- In the
Field Selectorwindow create aPoint Data Plotdisplay using theRAOB Point Datafield.
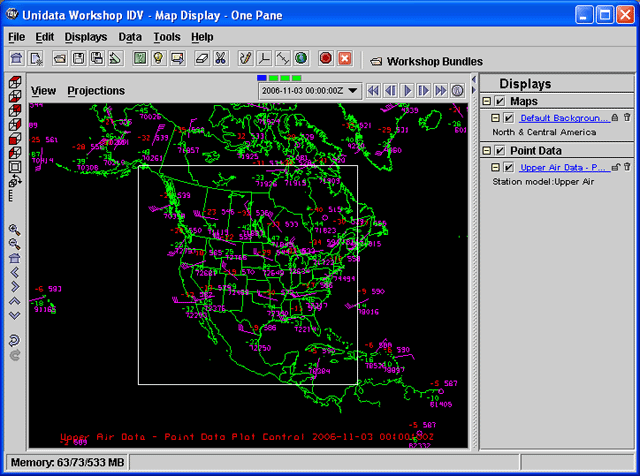
The point data plot appears in the main window.

Projections→Predefined→US→CONUS menu).Point Data Plot control to change the
plot density to show more stations.- In the
Field Selectorwindow select a different level (e.g. 250 mbar) in theLeveltab of theData Subsetpanel. - Under the
Regiontab, select a region of interest. - Click the
Create Displaybutton.


