


The IDV and associated Jython scripting environment is capable of reading post-processed WRF output. Specifically, the output need to be on a non-staggered for optimal performance. Also, please understand that the Jython API for the IDV is under active development and calls using Java code must be used to temporarily fill in the gaps. Also, a fair amount of the documentation, such as lists of valid input for functions, can be found in either the IDV java source code or .xml documents; links to these files (hosted on the Unidata github site are provided throughout this part of the tutorial. That said, several analysis functions and basic I/O routines are exposed via Jython and are documented.
If you have participated in the WRF tutorial, then you are likely familiar with the output from the Hurricane Gustav simulation, which is what we will use in our example (although any WRF post-processed output should do fine).
The first step to working with the IDV and WRF output is to load the data. Before we load the data, let's take a moment to create a few helper variables to simplify changing datasets in the future:
|
| Variable | Usage |
filename |
name of data file (use full path to file or the path relative to the location where the script will run) |
file_opener |
Type of data file |
The lines in the above code snippet hold the basic information needed to open a file. The variable filename is the name of the WRF file to be opened; file_opener must point to the id of one of the datasource types the IDV knows — a list of these can be found in datasource.xml (note that the "label" properties in datasource.xml may look familiar, as these names are used in the IDV data chooser). In our example, a GRIB file is what we wish to open, which coresponds to the id "file.grid" (the label is "Grid files (netCDF/GRIB/OPeNDAP/GEMPAK)"). Now that the basic information about the file has been defined, we can create a dataSource using the Jython method makeDataSource.
|
Note that makeDataSource returns a DataSource object, which we've named ds in our example.
Now we need to make some decisions regarding which data and display types we would like to use. As in our first step, let's create a few helper variables to hold this information:
|
Four new variables were added to the example:
| Variable | Usage |
variable |
Data variable to be displayed |
display_type |
Type of display to produce |
image_dimensions |
Dimensions of the output image |
output_name |
Name of the image file to produce* |
| *note: the format of the image is controlled by the extension used, e.g. .png) | |
display_type must be one of the types that the IDV knows — these can be found in controls.xml. controls.xml contains a listing of the display controls available in the IDV. Each control has various properties, some of which you may be familiar with if you've used the IDV (for example, the label property); however, for the purposes of Jython scripting, we need to use the id property. In our example, we are going to create a "Contour Plan View" display (the label property) which has the id 'planviewcontour'.
We are now at the point where we can generate an image with a few additional lines of Jython:
|
The resulting image will look something like this:
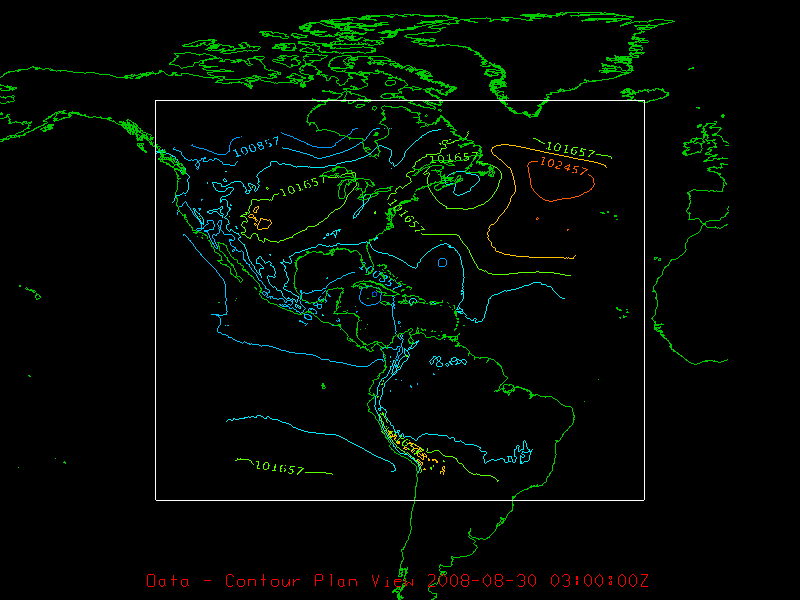
It's not the prettiest, but it does show the data. However...