- Open up the Color Table Editor from the
Tools→Color Table Editormenu if it is not already open. - Select the default color table if it is not already displayed.

- Rename this color table by selecting the
File→Save As...menu and entering the name "Comfort". - You should now have the same looking color table but with a new name
displayed. We will create
a new category, "Workshop" for this color table.
More on categories

- Click in the
Categorybox and type "Workshop" and press return. - Now save this new color table by selecting the
File→Savemenu item. - Verify that you indeed have a new category by selecting the
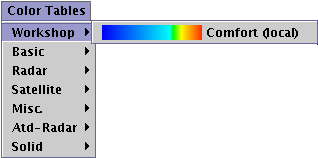
Color Tablesmenu.
You should see:
- Now, note the Range values 0.0 - 100.0.
The range values in the Color Table Editor are there for convenience purposes only. They allow you to see at what areas in the color table certain values would be shown in actual use.We are going to set these to an example range for temperature in Celsius.
- Type in -45 in the first box and press return.
- Type in 45 in the second box and press return.
- You should see the new range values displayed below the color box.
- Add breakpoints at the 0 value (freezing), 15 (comfortable), and 25 (hot).
- Right click on the color bar to bring up the
Color Bar Menu: - Select
Add Breakpoint→Here - You should see a color bar with a new breakpoint in the middle:
- Click and drag the breakpoint to the 0 value. If you cannot get to
exactly
0 then use
either the right/left arrow keys or right mouse click on the breakpoint
and
select the
Change Breakpointmenu item and enter the desired value. - An alternative method would be to add a breakpoint at a particular value
is
to select the
Add Breakpoint→At Data Pointmenu item and enter the value 0. - Repeat the above steps for the values 15 and 25.
- Your color bar should look like:
- Now, let's come up with an interesting color scheme.
- Click on the
Fill Edit Modebutton. - Select the center breakpoint (i.e., the "0" value point) by clicking on it.
- Set the color under this break point to white by using the color chooser.
- Right click on the center breakpoint and select the
Set Colors→Interpolate Leftmenu item. - How the rest of the Comfort color table is colored is an exercise left to the reader.
- Once you are done you should save this color table by selecting the
File→Savemenu item.


