- RAOBs (balloon soundings)
- numerical weather prediction model output with temperature and humidity. The dew-point temperature is computed by internal code from temperature and relative humidity grids.
- from a local file that contains aircraft track data.
To load sounding data see Choosing a RAOB Data Source from a Remote Server and Choosing a Gridded Data Source from a Remote Server.
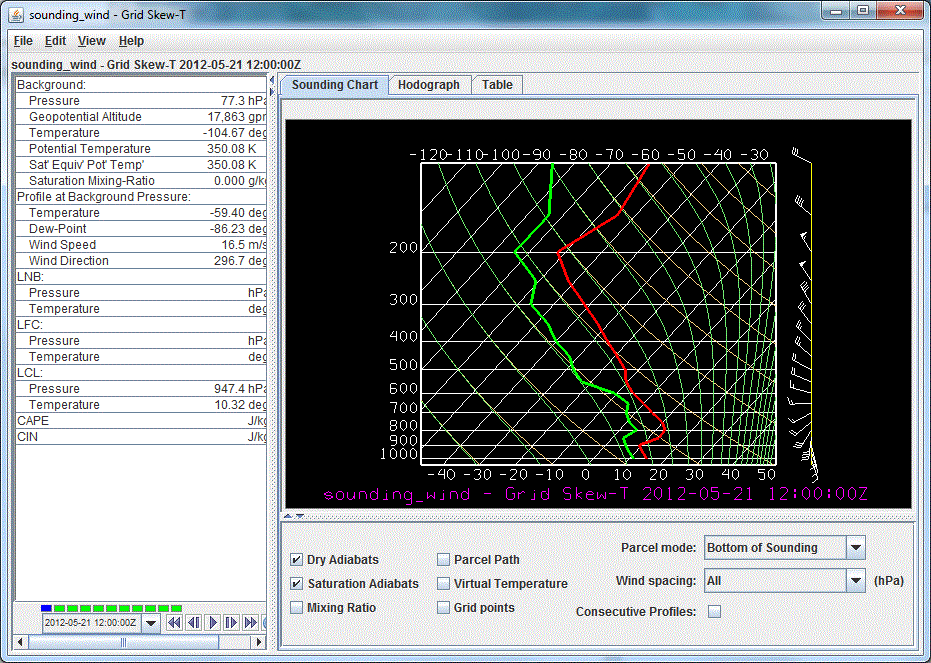
The IDV Sounding Display includes an aerological (thermodynamic) diagram (e.g., Skew-T, Stuve, Emagram), a table of related aerological parameters, a hodograph and a table readout of the data.

Image 1: The Grid Sounding Control with a Skew-T
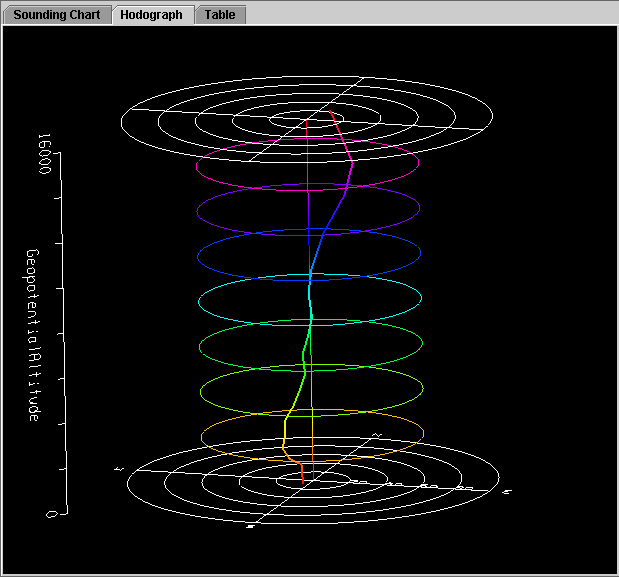
The hodograph display is enabled if the plotted data includes wind fields. You can rotate the display to see the vertical structure as well as the horizontal structure of the winds.

Image 2: The Hodograph View
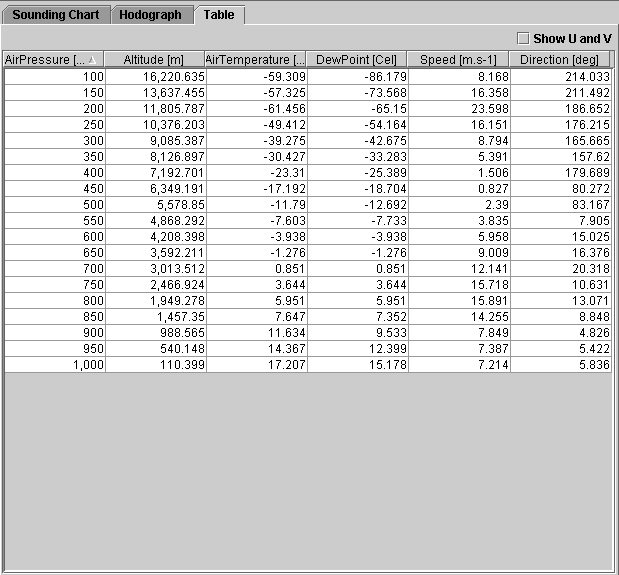
The Table tab shows the data in table form:

Image 3: The Sounding Table View
A label at the top of the sounding window shows the latitude-longitude position of the sounding. RAOB station location is shown on the main IDV display as a small colored square. When displaying sounding plots made from gridded model output, the position of the sounding is shown in the main 3D view window by a solid-color selector point and vertical line. You can move this model-output-based sounding position over the map by dragging the selector point with the left button.
When displaying a sounding diagram made from model output, you can use the time animation control to step through the time sequence.

To increase precision using the sounding diagram, enlarge the window by dragging on the edges. You can zoom the sounding diagram by holding down the Shift key and dragging the right button upwards; drag downwards to zoom out. You can pan the diagram by dragging the mouse pointer in any direction while pressing the right mouse button.
The temperature and dew-point traces can be modified via the cursor. Press the left button on the first data-point to be modified and drag it horizontally along an isobar to the desired position, then move the pointer diagonally along an isotherm to keep the data-point at the desired position and to pick-up the next data-point. Repeat until done and then release the mouse button.
The Parcel Path checkbox allows for the selection of the origin of the path of a parcel of air lifted pseudo-adiabatically from the initial point to the top of the diagram. Check Parcel path to display the path of a lifted parcel.
The Virtual Temperature checkbox controls whether or not the virtual temperatures of the environmental profile and pseudo-adiabatically lifted air-parcel are displayed.
The Grid Points checkbox controls turns on the display of the grid points in the main display.
The Parcel Mode menu allows for the specification of how the initial conditions of the pseudo-adiabatically lifted air-parcel (i.e. the parcel's pressure, temperature, and moisture content at the start of the pseudoadiabatic lifting) are determined from the environmental sounding (i.e. the temperature and dew-point profiles according to the mode indicated by . choices are:
- Bottom of Sounding. The initial conditions of the parcel are determined from the temperature and dew-point at the lowest (i.e. highest pressure)
- Below Cursor The initial conditions of the parcel are determined from the temperature and dew-point profiles by computing the pressure-weighted mean potential temperature and water-vapor mixing-ratio of the atmosphere that lies below the cursor when the middle mouse button is pressed. Thus, pressing the middle button at 950 hPa for a sounding that starts at 1000 hPa will effectively mix the lower 50 hPa of the atmosphere and lift the resulting parcel starting at 975 hPa.
- At Cursor Pressure. The initial pressure, in-situ temperature, and moisture content of the parcel are taken from the temperature and dew-point profiles at the pressure of the cursor when the middle mouse button is pressed. In At Cursor (Press, Temp) mode, the initial pressure and in-situ temperature of the parcel equal the pressure and temperature values under the cursor when the middle mouse button is pressed. The initial moisture content is determined from the dew-point profile at the initial pressure.
- At Cursor (Press, Temp). The computed path of a lifted parcel is automatically updated when appropriate. In both Below Cursor, At Cursor Pressure, and At Cursor (press, temp) modes, the path will update as the cursor is dragged. In all modes, the path will update whenever the profiles change.
The Consecutive Profiles checkbox controls turns on the display of two profiles consecutive in time. The dash line is for the earlier time step, and the solid line is for the later time step. This allows user to compare the stability change in the atmosphere. If the pair of the profiles not consecutive in time and you want to do the comparison, you need to remove those time steps between them through the field selector data subset panel.
The Customize menu allows the user to control what is shown
in the display (e.g., Dry Adiabats, Saturation Adiabats, Saturation Mixing Ratios)
and to switch the diagram type between Skew-T, Stuve and Emagram.
Sounding menu to allow for the selection
of the sounding to display:

Click on the Stations check-box in the lower right corner to toggle visibility of the RAOB station location mark in the main display window.
- LCL
- Lifting Condensation Level: the level at which a pseudo-adiabatically lifted air-parcel becomes saturated with water-vapor.
- LFC
- Level of Free Convection: the level at which the virtual temperature of a pseudo-adiabatically lifted air-parcel changes from being less than the environment's virtual temperature to being greater than the environment's.
- LNB
- Level of Neutral Buoyancy: the level above the LFC at which the virtual temperature of a pseudo-adiabatically lifted air-parcel equals the environment's virtual temperature.
- CAPE
- Convective Available Potential Energy: the area between the virtual temperature trace of the pseudo-adiabatically lifted air-parcel and the virtual temperature trace of the environment from the LFC to the LNB in which the parcel's virtual temperature is greater than the environment's (positive CAPE connotes convective development).
- CIN
- Convective Inhibition: the negative of the area between the virtual temperature trace of the pseudo-adiabatically lifted air-parcel and the virtual temperature trace of the environment from the parcel's initial conditions to the LFC in which the parcel's virtual temperature is less than the environment's (negative CIN connotes initial positive work to lift the parcel).


