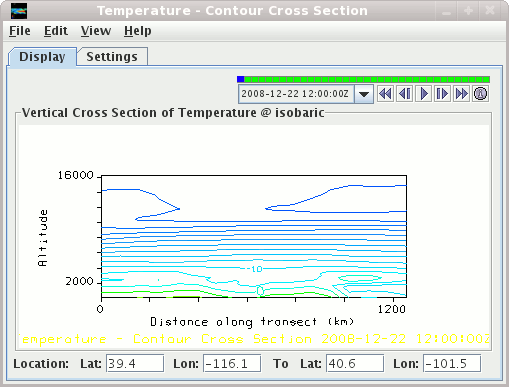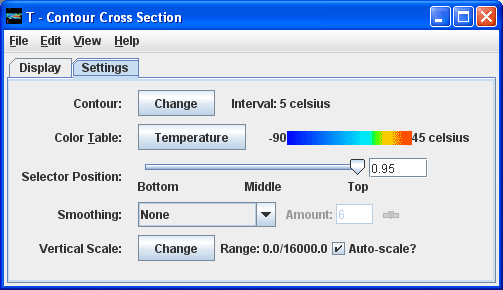

Vertical cross sections can be made in three types of displays, with contour lines, color-filled contours, and as a color-shaded image.
- Location
This shows the location of the end points of the cross section
- Contour
To set contour information use the Contour: Set button, which brings up the Contour Properties Editor.
- Color Table
The control has a color bar showing the active color table and the associated high and low data values in the units the display is made in. As the mouse pointer is moved over the color bar, the value at a particular color is shown. Click on the color bar to start the Color Table Editor. Or click on the button that displays the name of the color table to show a popup menu that allows you to change the range, select other color tables, etc.
- Visible Range
In the Color Shaded Cross Section View the
Visible Rangeallows you to set the range that determines what parts of the data is actually shown. - Selector Color
You can change the color of the selector line with the
Edit→Selector Color→menu - Smoothing
This control has an option to smooth the grid that can be used to smooth contour lines or flow fields for display. There are 6 types of smoothing: 5-point, 9-point and gaussian weighted, Cressman, circular and rectangular aperture smoothers. The amount of smoothness can be set for the gaussian smoother. The higher the amount, the smoother the grid. For the Cressman, circular and rectangular aperture, the factor is the radius in grid spacing units.
- Vertical Scale
You can change the vertical scale of the 2D cross section view. The Auto-scale checkbox, when checked, will scale the Y-AXis of cross section to the sampled data range.
- Time Animation Control

controls looping of displays when more than one data time is loaded. See more in Time Animation Control. - Display
Use left-mouse button drag on the colored squares on the positioning line in the main view window to reposition the cross section.


