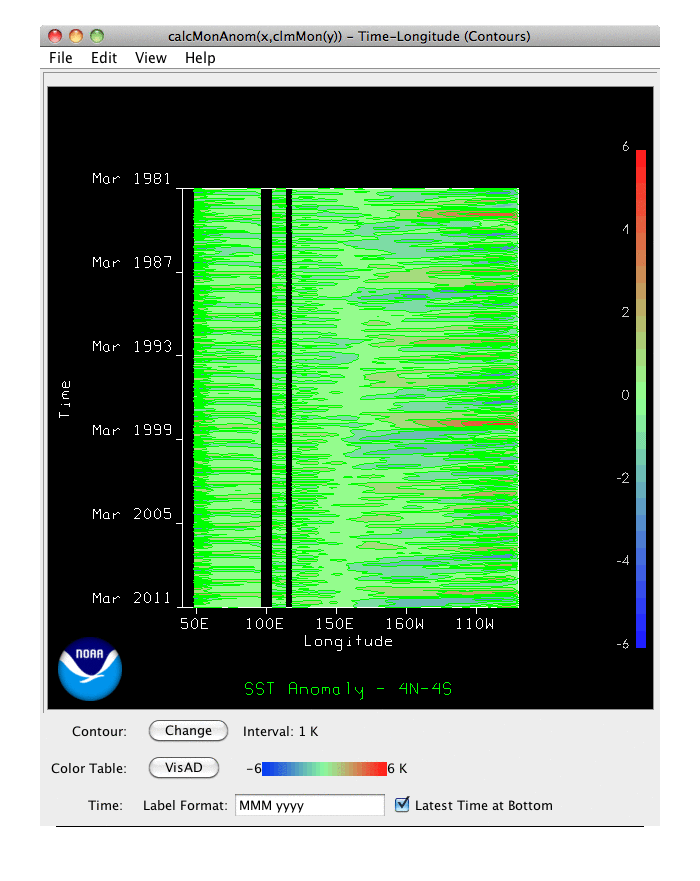
- Contour
To set contour information use the Contour: Set button, which brings up the Contour Properties Editor.
- Color Table
The control has a color bar showing the active color table and the associated high and low data values in the units the display is made in. As the mouse pointer is moved over the color bar, the value at a particular color is shown. Click on the color bar to start the Color Table Editor. Or click on the button that displays the name of the color table to show a popup menu that allows you to change the range, select other color tables, etc.
- Time
The Label Format adjusts the format of the time labels. See the User Preferences for date format information. The Latest Time at Bottom checkbox reorders the y axis of the display.


