

When you define an IDV formula, it is saved and will appear in future runs of your IDV.
To create a formula select the Edit->Formulas->Create Formula
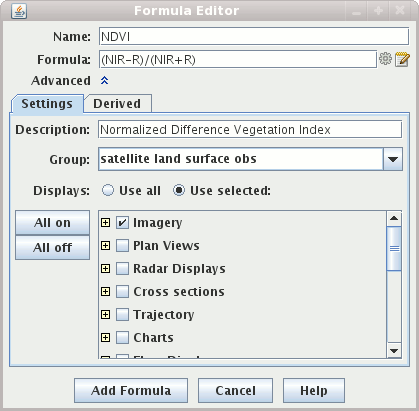
menu item. This brings up the Formula Editor dialog box
used to define a formula:

If the formula name matches a name in the main Edit Menu Parameter defaults, then color tables and other settings may be automatically assigned, which may or may not be desirable for you. For example, if you choose a formula named T its displays would get the color tables associated with temperature.
In the formula itself you can use common mathematical operators much as +, -, * for multiply, / for divide, and ** for power. Other Jython operations such as sqrt(a), max(b), pow(a,b), and sin(c) are available. In the Jython Methods section of the User Guide you will see how to write complete complete multi-line functions or methods in Jython that you can call in one-line formulas.
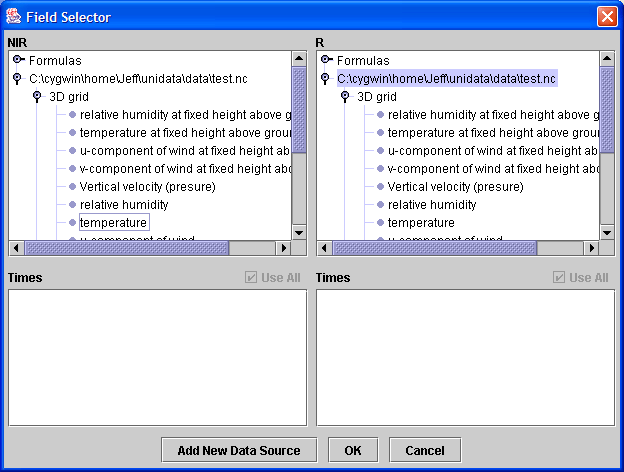
The variable names in the formula definition, such as "NIR" in the figure above, are operands and do not need to exactly match any particular parameter name in any data source; the association is made later, in the parameter selection step.
Do not use spaces in formula variable names, such as "wind speed." The formula is an expression in the Jython language. Start each variable name with a letter.
It is best to use variable names that suggest the parameter data they represent, so that later you can easily remember what the variables should represent.
Variable names can have extra "syntactic sugar" attached to them that the IDV uses for a variety of purposes. The "sugar" consists of a set of name/value pairs contained in brackets ("[...]") after the variable name.
You can specify a label that is shown in the user interface:
someProcedure(someDataValue[label=The label to use])You can specify the types of data that can be selected for a variable with the categories name. e.g.:
someProcedure(someDataValue[categories=param:ALTITUDE])If you want multiple data categories separate them with a ";":
someProcedure(someDataValue[categories=param:ALTITUDE;param:elevation])If you only want to select 3D grids do:
someProcedure(someDataValue[categories=GRID-3D-*])If you only want to select 3D or 2D grids do:
someProcedure(someDataValue[categories=GRID-3D-*;GRID-2D-*"])You can also specify a regular expression pattern that is used to pre-select the first data choice whose description matches the pattern.
someProcedure(someValue[pattern=some_pattern])Not only can you specify fields from data source you can also define that certain operands are text and other values from the user with the "isuser=true" operand attribute. For example, evaluating the following expression:
someProcedure(someValue[isuser=true])will result in a dialog box being shown to allow for the user to enter a text value (e.g., a number) for the variable someValue.
You can provide default values with:
someProcedure(someValue[isuser=true,default=some default])If you wanted to have a multiple line text area for input you do:
someProcedure(someValue[isuser=true,rows=5])You can use the "type" attribute to define other types of input. For example, if you wanted to have a checkbox you do:
someProcedure(someValue[isuser=true,type=boolean])A menu of choices can be constructed with:
someProcedure(someValue[isuser=true,type=choice,choices=Apples;Bananas;Oranges;])A latitude/longitude can be chosen:
someProcedure(someValue[isuser=true,type=location,default=40;-107])
You can support multiple selection of fields using:
someProcedure(someValue[multiple=true])This will result in a field selector with a list of selected fields at the bottom. When enabled you can double click on a field to add it. The actual object that gets passed to the formula Jython code is a list of the fields.
In the advanced section you can enter a description of the formula, its group or category and you can define what types of displays are applicable for the given formula (the default is to be able to use all displays).
The group is used to display the formula in the Field Selector window and can be any alphanumeric text including spaces, numbers, and punctuation characters. Hyphens ("-") define sub-categories.
To save the formula, click on Add formula. A new entry appears in the selector panel. By right clicking on the formula entry in the Field Selector window you can edit the formula. To remove a formula, click on Remove Formula in the pull down menu.
When you create a display the IDV needs to know what actual data should be bound to the operands within your formula. A Field Selector window will appear that allows you to select the actual data for each operand. You can select parameters from more than one data source for use in a single formula, for example, you can pick the same parameter from data sources of different times to compute a time difference in the parameter.
