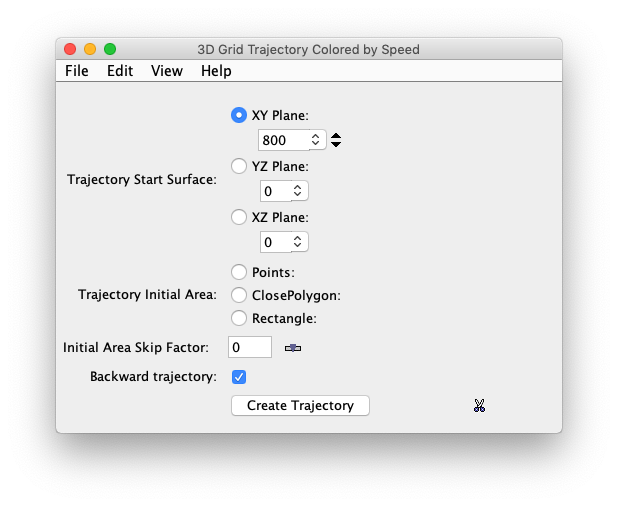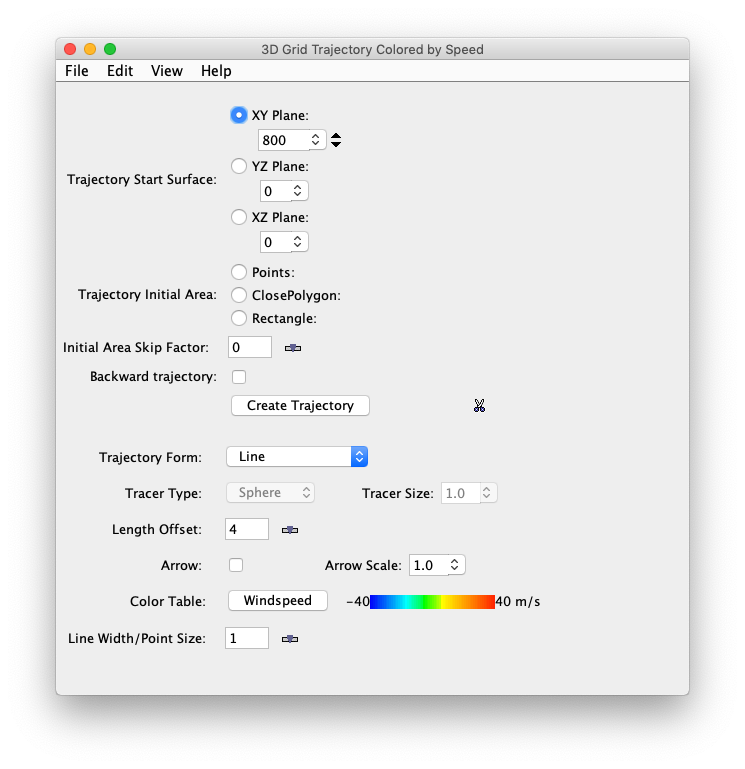

- XY Plane
When the XY Plane is selected, user can click on the Levels box to see a pull down menu of the native grid levels. Click on one level value to reset the trajectory start surface to that level. The plan level in use is shown in the data's native altitude units. The Levels box is editable. Click in the box, enter a value and hit return to set your own value.
- YZ Plane
When the YZ Plane is selected, user can click on the index box to see a pull down menu of the native grid index in X direction. Click on one index value to reset the trajectory start surface to that index surface.
- YZ Plane
When the XZ Plane is selected, user can click on the Index box to see a pull down menu of the native grid index in Y direction. Click on one index value to reset the trajectory start surface to that index surface.
- Points
This is an option for the initializing the trajectory initial area when the start surface is on XY Plane. When the control is first created, it is the default option. Every time the user left-clicks on the view window, a marker is placed to mark a initial point. After the trajectory is created, the default is unchecked and the user needs to specify one of the options for next initialization. When the user changes the initial option, the display of the initial area and the trajectory on the view window will be removed.
- ClosePolygon
This is an option for the initializing the initial trajectory area. When this option is selected, click and hold the left mouse button and draw a polygon in the view window.
- Rectangle
This is an option for the initializing the initial trajectory area. When this option is selected, click and hold the left mouse button and drag a rectangle in the view window.
- Skip Factor
To avoid cluttering the display you can define the number of grid points that are skipped with the Skip Factor combo box. A skip interval of 0 mean show all grid values, 1 means skip every other one, 2 means show every third one, etc. A skip factor can only be applied to a close polygon initial area.
- Backward trajectory
This is an option to create a backward trajectory. The initial area specifies where trajectories end at the last time step.
- Create Trajectory
After selecting the level and specifying the initial area, click on the button Create Trajectory to create the display.
- Remove all glyphs
This is an icon on the right of the Create Trajectory button. Click on the icon to remove the display.
- Trajectory Form
Click on the button that displays the name of the trajectory form to show a popup menu that allows you to change the trajectory display type: Line, Ribbon, Cyinder, Deform Ribbon, and Point.
- Tracer Type
If the trajectory form is TRACER then this popup menu will be enable to allow user to change the tracer type: Sphere, Dot, and Arrow.
- Length Offset
This slider allows you to set the length of the displayed trajectory line. Or type a new value into the text field.
- Arrow
If the trajectory form is LINE then the Arrow and Arrow Scale widgets will be enable to allow user to select this option.
- Color Table
The control has a color bar showing the active color table and the associated high and low data values in the units the display is made in. As the mouse pointer is moved over the color bar, the value at a particular color is shown. Click on the color bar to start the Color Table Editor. Or click on the button that displays the name of the color table to show a popup menu that allows you to change the range, select other color tables, etc.
- Line Width/Point Size
This slider allows you to set the width of the displayed trajectory line or point size. Or type a new value into the text field.


