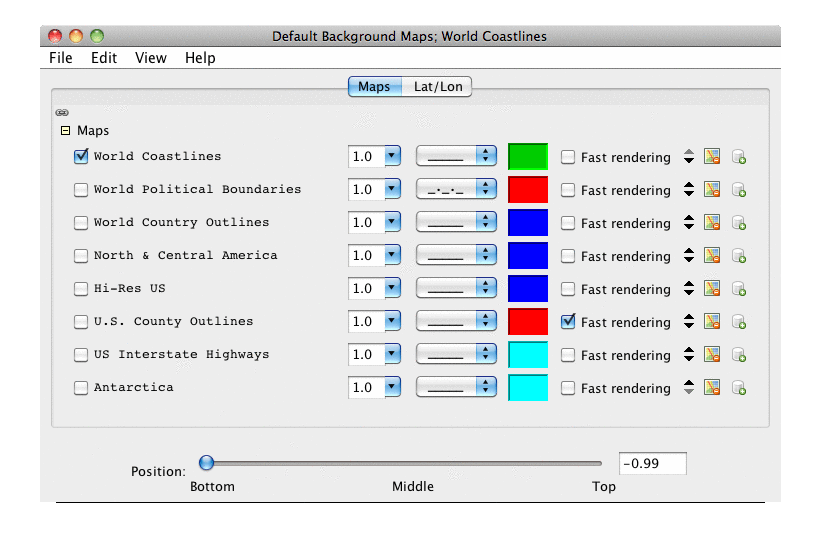

Edit menu. You can
choose to add any of the predefined maps available to the IDV or
you can select a map file (e.g., a shape file) from the file system.
The File->Default Maps->Save as the Default Map Preference
menu item allows you to save the current set of maps
in a display as the default maps. When a new view window is created
the maps that are saved as the default are used as the background
maps.
Note: Once you save a set of maps as the default maps then every time your create a new display those maps and those maps only will be used. If you were to add a set of new maps using a plugin then those maps will not show up by default in your display.
To clear the default maps, choose the menu item
File->Default Maps->Remove Local Map Defaults.
- Maps
This list shows the set of currently loaded maps. In this list you can remove a map, change its visibility, line width, style and color. The
Fast Renderingbutton, when on, can save on rendering time by not checking for projection seam crossings. Note: some maps will display incorrectly when fast rendering is turned on. The "plus" icon on the right allows you to add the given map as a Map Data Source. This allows you to do display the given map in 3D draped over topography and/or do spatial analysis using the map (e.g., grid averages within a map).The link button, when set to linked, will apply any change to a particular map (e.g., color, line width) to all visible maps.
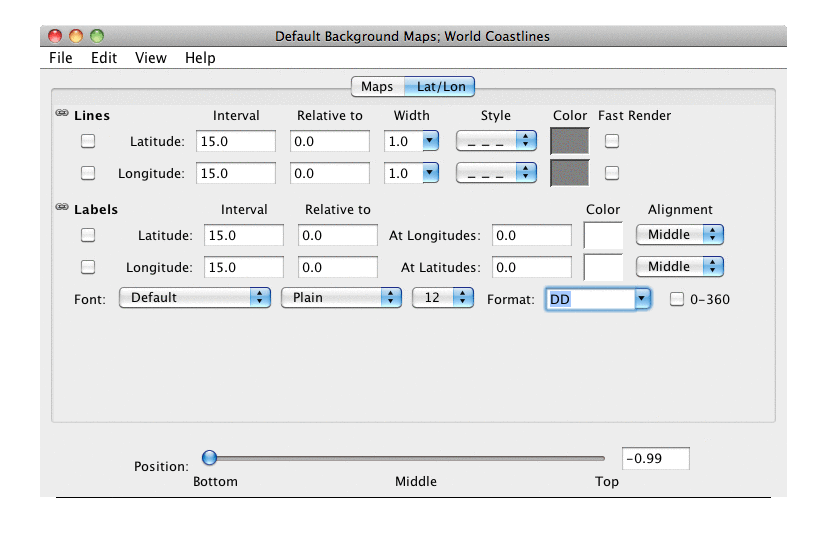
- Latitude/Longitude Lines
These controls allow you to display latitude and longitude lines. You can set the visibility, interval, base value, line width, line style and color.
The link button, when set to linked, will apply any changes to a latitude or longitude line to the other line.
- Latitude/Longitude Labels
These controls allow you to display latitude and longitude labels. You can set the visibility, interval, base value, label locations, color, alignment, font and format.
The labels will be spaced out based on the interval and relative to (base) values. For example, if you have an interval of 15 and a base of 0, the labels will be ...-30, -15, 0, 15, 30... If the base it 5, the labels will be ...-25, -10, 5, 20, 35...
The
At XXXoptions let the user select which lines the labels are placed at. TheAlignmentoption lets the user select the positioning of the label relative to the point being labeled. It is based on a compass notation where NW would be positioned up and to the left of the point, N would be above the point, etc:NW N NE W Middle E SW S SEThe
Fontselector allows you to set the Font name, style and size of the labels.The
Formatselector allows you to set the format for the labels. The acceptable characters are DD (degrees), MM (minutes), SS (seconds), H (hemisphere - N,S,E,W), and one or more of d (decimal degrees), m (decimal minutes), s (decimal seconds). The0-360checkbox will format longitude labels using 0-360 notation instead of -180 to 180. Examples:DDH -> 34N, 43S DD:MM:SS -> -67:45:33 DD.dd -> 45.05, -117.34 DD MM" SS'H -> 67 45" 33'WThe link button, when set to linked, will apply any changes to one set of latitude or longitude labels to the other labels.
- Position
This slider allows you to set the vertical position of the maps and latitude/longitude lines and labels.


