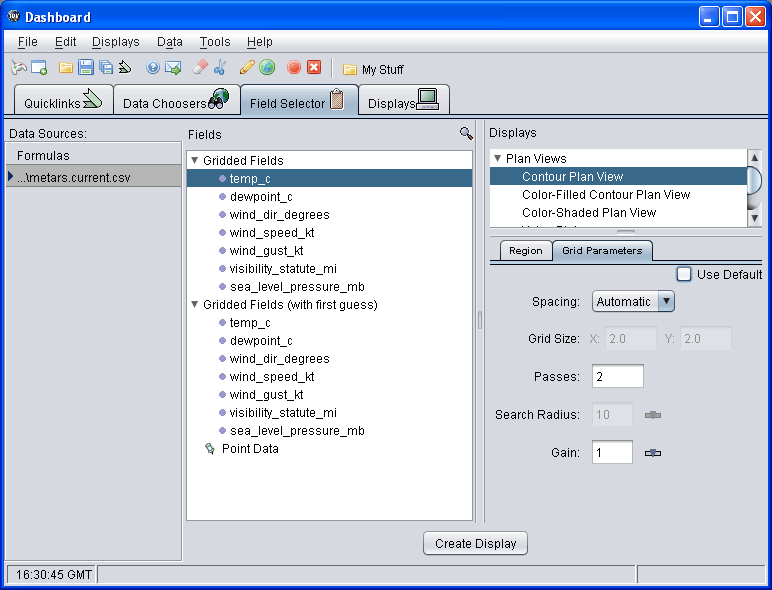
You can control the parameters used to create the grid from the Data Source Properties or using the "Grid Parameters" tab in the Data Subset panel of the Field Selector:

- Spacing
You can set the grid spacing as follows:
- Automatic - grid spacing will be calculated from the observation density
- Degrees - use a specific lat/lon spacing
- # Points - set the number of grid points in the x and y direction
- Grid Size
Specify the grid spacing if not using automatic calculation.
- Passes
Set the number of passes for the Barnes analysis to do 4 passes recommended for analysing fields where derivative estimates are important (Ref: Barnes 1994b) 3 passes recommended for all other fields (with gain set to 1.0) (Ref: Barnes 1994c "Two pass Barnes Objective Analysis schemes now in use probably should be replaced by appropriately tuned 3pass or 4pass schemes") 2 passes only recommended for "quick look" type analyses.
- Search Radius
Set the search radius (in grid units) for the weighting of points in determining the value at a specific grid point.
- Gain
Factor by which scaleLength is reduced for the second pass. Should be in the range 0.2 to 1.0. Data are fitted more closely with a gain of 0.2 (at the expense of less overall accuracy over the entire grid); larger values smooth more. Suggested default: 1.0f Set the gain for each pass after the first.
- First Guess Field
You can use a model grid as a first guess field for the analysis. Select the "Grid Parameters (with first guess)" field and you will be prompted to select the gridded field to use for the first guess.
- References
- Barnes, S.L., 1994a: Applications of the Barnes objective analysis scheme
Part I: Effects of undersampling, wave position, and station randomness. J.
Atmos. Oceanic Technol. 11, 1433-1448.
- Barnes, S.L., 1994b: Applications of the Barnes objective analysis scheme
Part II: Improving derivative estimates. J. Atmos. Oceanic Technol. 11,
1449-1458.
- Barnes, S.L., 1994c: Applications of the Barnes objective analysis scheme
Part III: Tuning for minimum error. J. Atmos. Oceanic Technol. 11, 1459-1479.
- Barnes, S.L., 1994a: Applications of the Barnes objective analysis scheme
Part I: Effects of undersampling, wave position, and station randomness. J.
Atmos. Oceanic Technol. 11, 1433-1448.


