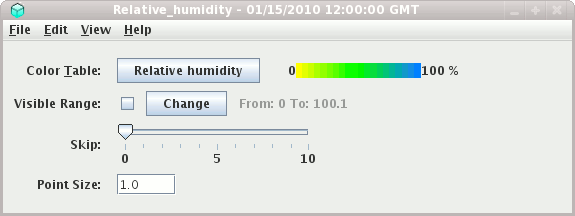
You can change the visible range and the transparency of the color table to view sections of the 3D volume of data.
- Color Table
The control has a color bar showing the active color table and the associated high and low data values in the units the display is made in. As the mouse pointer is moved over the color bar, the value at a particular color is shown. Click on the color bar to start the Color Table Editor. Or click on the button that displays the name of the color table to show a popup menu that allows you to change the range, select other color tables, etc.
- Visible Range
The
Visible Rangeallows you to set the range that determines what parts of the data is actually shown. Check the box to enable the widget and use theChangebutton to set the data range. - Skip
You can choose to skip a certain number of grid points to make a less dense display.
- Point Size
You can change the size of the displayed points with the Point Size widget. Enter a point size and hit return.


