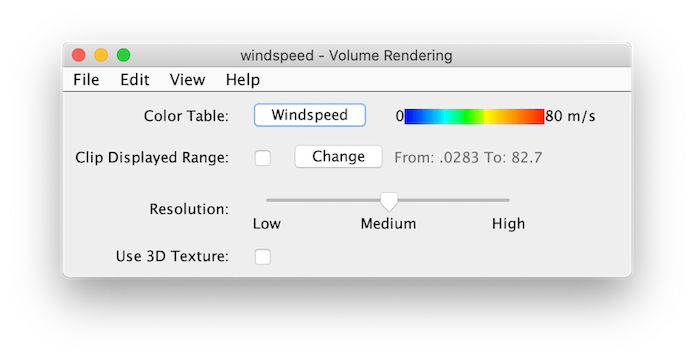
You can use the transparency features of the color table to see into the cloud.
- Color Table
The control has a color bar showing the active color table and the associated high and low data values in the units the display is made in. As the mouse pointer is moved over the color bar, the value at a particular color is shown. Click on the color bar to start the Color Table Editor. Or click on the button that displays the name of the color table to show a popup menu that allows you to change the range, select other color tables, etc.
- Visible Range
The
Visible Rangeallows you to set the range that determines what parts of the data is actually shown. Check the box to enable the widget and use theChangebutton to set the data range. - Resolution
You can adjust the size of the resample points to improve the quality of volume rendering with the Resolution Slide widget.
- Use 3D Texture
By default, the volume rendering uses a 3D Texture mode. On some systems (notably Macs), the volume may appear as a grey blog. Unchecking this option will use a different (although poorer quality) rendering mode.


