


Run Analysis button at the bottom of the screen of the ADT control. Once the
analysis has completed a popup window will appear containing the ADT Analysis Bulletin output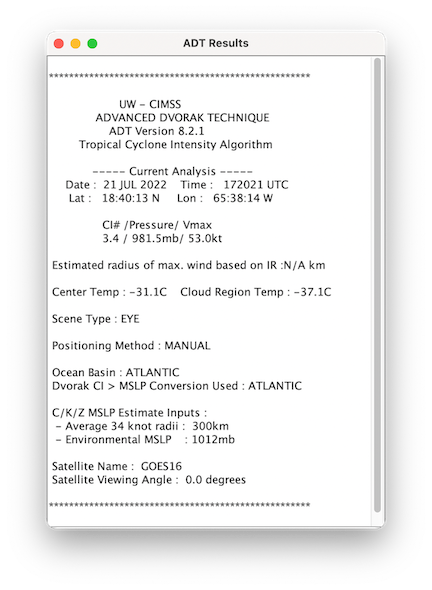
The ADT is still experimental and may have bugs that have not been found and we are keep working on the development of the connection of the automated storm selection with the National Hurricane Center online ATCF Best Track files.
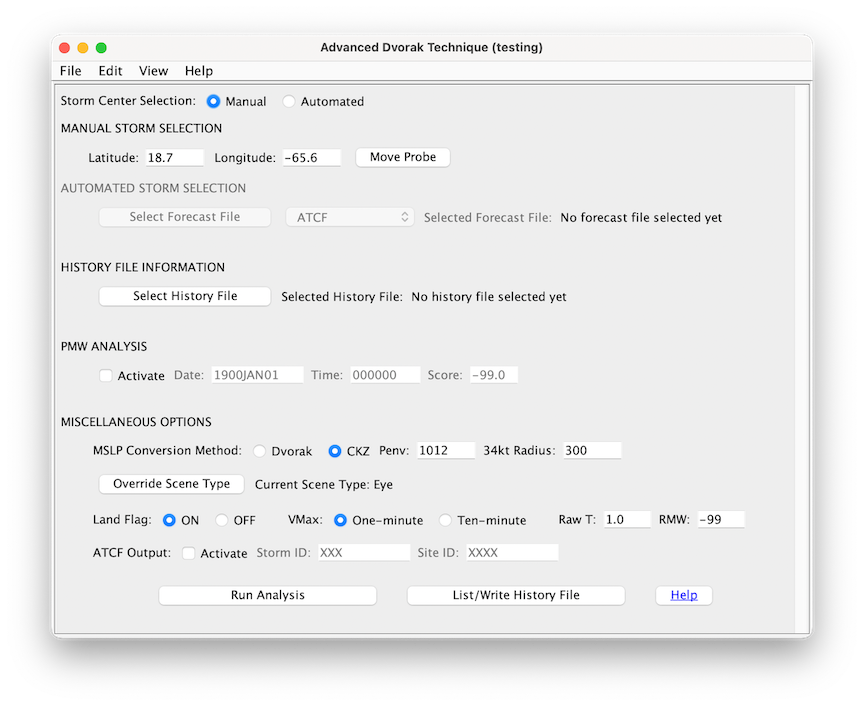
If the Manual option (default) is utilized, the storm position is selected manually by the user in the Display Window. A colored dot will mark the storm position selected, with the corresponding position displayed in the ADT GUI window in the Latitude and Longitude text boxes in the "Manual Storm Selection" section. To select the storm center, left-click and drag the probe in the Main Display window.
There are several operations on an existing ADT History file. To initiate, first select a history file in the "History File Information" section by clicking on the "Select History File" button and choosing a history file. Once a history file is chosen, press the "List/Write History File" button at the bottom of the "Layer Controls" tab. A new popup window will be displayed containing the history file listing of the selected history file along with two buttons at the bottom of the window.
To initiate the "PMW Analysis" section, click on the "Activate" checkbox. The "Manual" entry option button will be activated along with the three text entry boxes corresponding to the PMW overpass Date, Time, and Eye Score values. Please note that you MUST press "Enter" on the keyboard after entering input into each text window! The "Automated" option will be grayed out since this option is not available in this version of the McV-ADT, as mentioned above. Also note that the use of the PMW Analysis is only available when utilizing an ADT History file.
MSLP Conversion Method defines the methodology used to convert the CI#/Wind Speed value to
mean sea level pressure. The "Dvorak" option (default) will utilize the historical Atlantic or West Pacific
conversions. The "CKZ" option will use the "Courtney/Knaff/Zehr" conversion, which requires two input
parameters to be supplied to the conversion equations; Environmental MSLP (Penv) and the 34-knot
wind/Gale radius (34kt Radius).Land Flag allows the ADT to operate over land if the "OFF" radio button is selected (default selection
is "ON", which will keep the land flag activated and forbid ADT analysis when the storm center is over a
significant land feature).ACTF Output allows the user to write an ATCF formatted intensity record to an output file (location
defined with the ODTOUTPUT variable in the adtenv file). The name of the file is automatically
determined and is based upon the image date and time along with two manually input variables.