To load in ATCF data select the Data→Special→ATCF Tropical Storm Data menu.
This creates a data source with a predefined
path to the National Hurricane Center ftp site. Then, create the Storm Track display.
The display control shows the set of available storms on the left panel organized by year and basin, e.g., Atlantic (AL), Eastern Pacific (EP) and Central Pacific (CP).
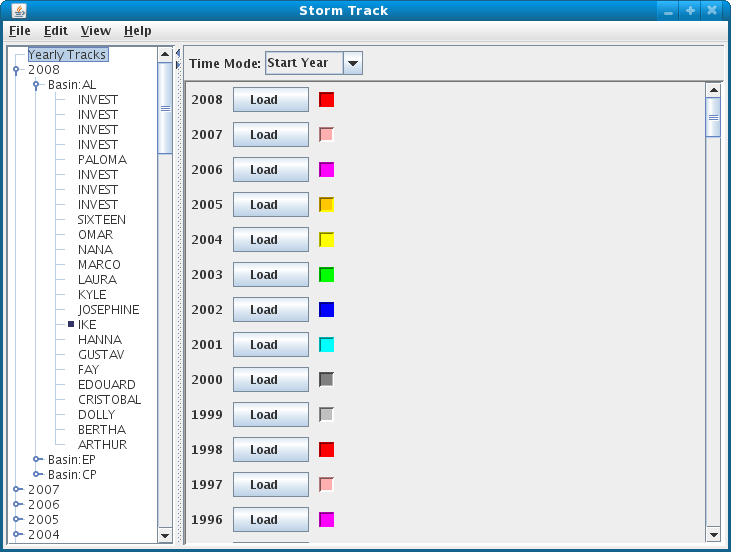
Load Tracks button.
You can load any number of storms but they are shown in different panels.
You can use the View→Storm Tracks menu to list out all of the loaded storms,
remove them all, etc. Once a storm is loaded it can be removed with the small "scissors"
icon shown in the upper right.
Once a storm is loaded
the first thing you should do is to specify which "Techs" (or models) to use by
bringing up the control's Properties dialog Edit→Properties menu.
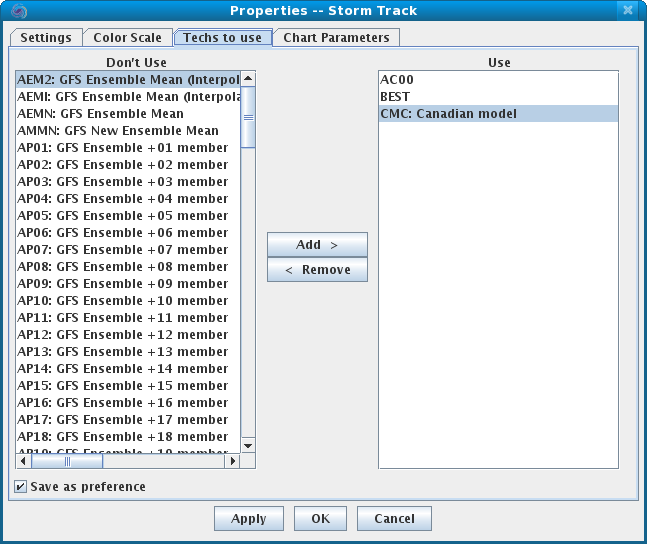
In the "Techs to use" tab, select all of the Techs in the "Use" list (click and press control-a)
and press Remove. This places them in the "Don't Use" list.
Select the desired Techs in the "Don't use" list and press Add.
You can also choose what parameters are to be used and displayed in the
"Chart Parameters" tab, repeat the same step to select the desired parameters.
If you want these selections
to be saved as a preference, please check the "Save as Preference" box.
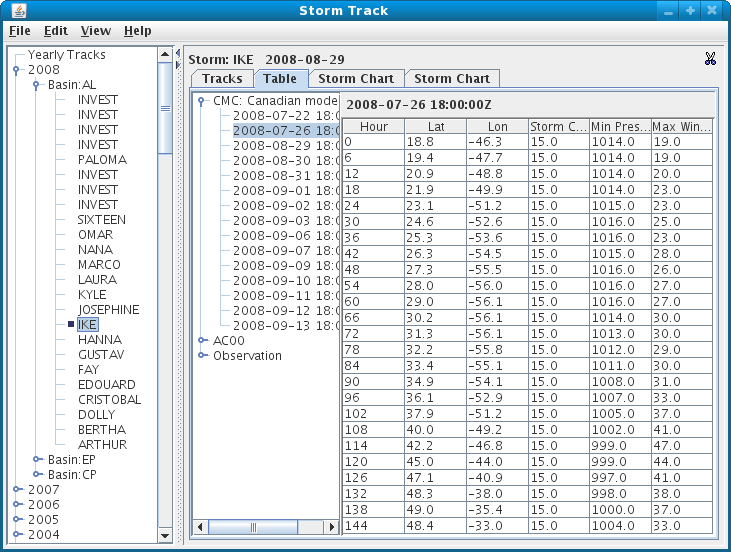
The Storm display panel consists of three tabs: Tracks, Table and Storm Chart.
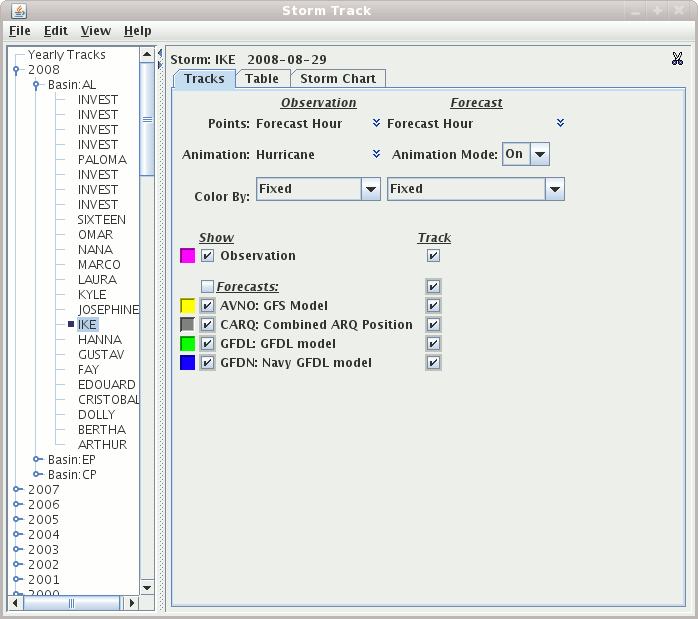
The Tracks tab controls the display and animation of the tracks.
The Points menus specify which Layout Model
to use for both the Observation as well as the Forecast tracks.
The Animation is the layout model to use for the Observation track
that moves along with the time animation.
The Animation Mode determines whether to animate the tracks or show
all of the tracks.
Using the Color By menus one can specify whether the track is shown with a fixed color
or using a color table. The color table used is a single one for the entire display control
and is set through the main Edit menu.
Under the Show table one can specify what is to be shown.
One can toggle on/off the visiblity of the Observation track, all of the forecast tracks
or individual forecast tracks.
File→Save→Export to Spreadsheet menu allows you to export
the track data to an Excel spreadsheet. In the File Dialog are options to
select what is to be saved.
Edit menu you can any number of new forecast time or
forecast hour charts. The forecast time chart is based around the model run time
of the selected forecasts. The forecast hour charts selects data across the different
model run times, e.g., you can show the 12 hour forecast from each model run.
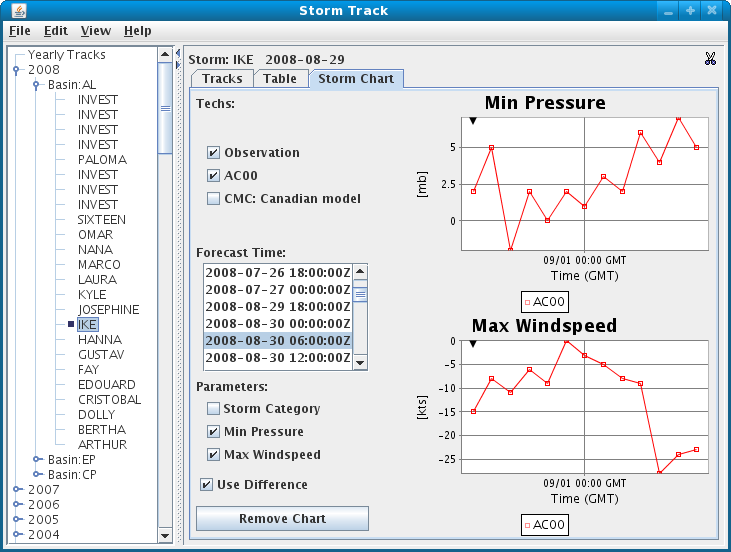
To do the charting of the storm track, one or more Techs need to be selected. Once selected the Forecast Hour/Forecast Time list is populated. One or more times can be selected (control-click). Each Parameter that is selected will result in a new chart shown on the right.
The Use Difference button, when selected, results in the display of the difference between
the forecast value and the observed value.
