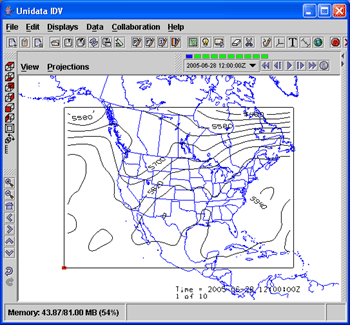
Image 1: 500 hPa height contours

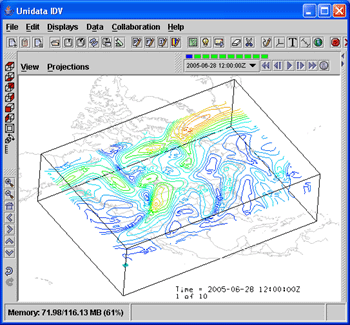
Image 2: Oblique view in 3D of colored contours of wind speed at 250 hPa

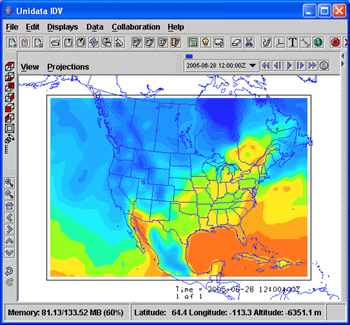
Image 3: Color-filled contours of surface temperature

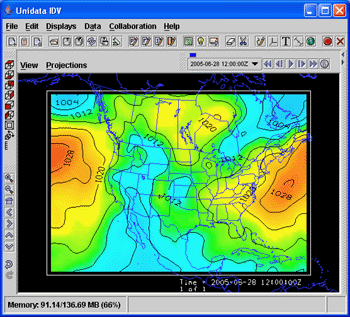
Image 4: Mean sea level pressure as a color-shaded image, and contour lines


Plan views can be displayed in several ways:
An IDV 3D Plan View can be set to any level of the data levels in the data source, or between data levels, in which case interpolation is used to estimate the data values in the plan view. A colored square selector point in the left corner of the 3D plan view can be moved up and down by dragging the mouse button to re-position the level. You can make several 3D plan views at the same time, for one or more parameters in 3D data. To learn how to make a display, see Getting Started: Plots from Gridded Data.
You can control the display appearance of plan views with the associated Plan View Control