

Unidata IDV Workshop for version 7.0u1 > Accessing and Displaying Data > Working with Gridded Data

3.2.5 Cross Sections of Gridded Data
Cross sections of data can be useful to show the variation of
a field along a transect. In the IDV, a cross section display
consists of a selector line and display in the main window,
and a 2D display of the cross section in the control window.
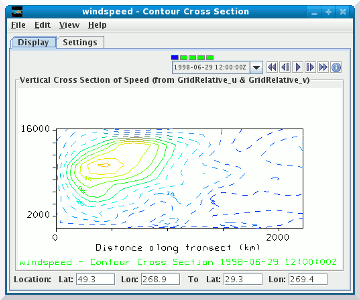
- First, we'll create a vertical cross section of contours of wind speed
and compare it to the isosurface made in the previous exercise.
- Remove all displays except the isosurface display from the
previous exercise.
- In the
Field Selector's
Data Sources panel, select
the ETA data source
that you loaded at the start of this section.
- In the
Fields panel, expand the
3D grid tab.
Scroll down to the Derived
tab to see a list of derived quantities. Select the
Speed (from GridRelative_u & GridRelative_v)
field.
- In the
Displays panel, expand the
Cross Sections tab and select
Contour Cross Section then
click the Create Display button.
You could also create a color-filled contour or color shaded
vertical cross section, but for the purposes of this exercise,
we will use the contour cross section.
- Move the cross section selector so it cuts perpendicularly across
the wind speed core (N-S line through Iowa from Duluth, MN to
New Orleans, LA). You can move the line by clicking and dragging
the end selector point on the selector line.
- Rotate the main display to the western view. Zoom in to get
a better view of the contours. Note that the 40 m/s contour
intersects the outer boundary of the isosurface.
- Bring up the
Contour Properties Editor
from the Settings tab of the control
window. Change the contour interval to 5, set the base to 30 and turn
on dashing. Then click the OK button.
The display changes so the contours are every 5 m/s and contour lines
below the base (30) are dashed.
- Start the animation. Note the southward progression of the
jet core.
- Stop the animation and return the display back to the first
time in the sequence and the view to the top.
- Remove the isosurface display from the main window.
Do not remove the cross section display.
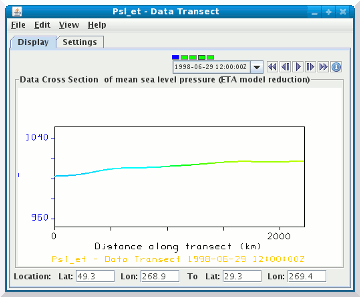
- You can also create cross sections of 2D parameters that will show
their variation along a transect. In this step, you will load in a plan
view of sea level pressure and then a data transect of that field.
- In the
Fields panel, expand the
2D grid tab.
Select the mean sea level pressure (ETA model reduction)
field.
- In the
Displays panel, select
Color-Shaded Plan View. Then, hold the
Ctrl key down and click on
Data Transect to select both. Click
the Create Display button.
- You should see a color shaded display of sea level pressure
and a new selector line for the data transect. Move the
data transect selector so it spans from high pressure (reds)
to low pressure (blues). Note how the display in the
control window changes as you move it around.
- You can share the position of cross section selectors between
two different displays. In each of the control windows,
(or by right clicking on the legend for each display)
select the menu and check
the checkbox. In the main
view window, drag one end of the vertical cross section
selector slightly. The selector for the data transect will
snap to the same position as the vertical cross section line.
- Start the animation. Is there any relation to the position
of the jet core and the sea level pressure?
- Stop the animation and return the display back to the first
time in the sequence and the view to the top.


Unidata IDV Workshop for version 7.0u1 > Accessing and Displaying Data > Working with Gridded Data


