

Unidata IDV Workshop for version 7.0u1 > Accessing and Displaying Data > Working with Gridded Data

3.2.4 Isosurfaces of Gridded Data
While plan views of 3D fields are useful, the three dimensionality
of the atmosphere can be displayed in the IDV using isosurfaces.
An isosurface represents a 3-D surface that connects points with the same
value. On one side of the surface, values are greater than the
surface value; on the other side, values are less than the surface
value.
- Create an isosurface of wind speed showing areas of winds 40 m/s
or greater.
- In the
Field Selector's Data Sources
panel, select the NCEP Model Data ETA data source
that you loaded at the start of this section.
- In the
Fields panel, expand
the 3D grid tab.
Scroll down to the Derived tab to see
a list of derived quantities. Select the
Speed (from GridRelative_u & GridRelative_v)
field.
- In the
Displays panel,
expand the 3D Surface tab and select
Isosurface, then
click the Create Display button.
- Set the isosurface to display where winds of 40 m/s or greater
exist. From the control window for this display, you can change
the isosurface value either by typing a
new value in the
Isosurface Value entry box
or by using the Isosurface Value slider widget
( )
to the right of the entry box. Change the isosurface value to
40 m/s.
- Start the animation.
- Rotate the display to see the wind speed pods from various angles.
- Stop the animation and return the display back to the first
time in the sequence and the view to the top.
- Remove the display from the main window by clicking on
the remove icon (
 )
or by selecting the control's
menu.
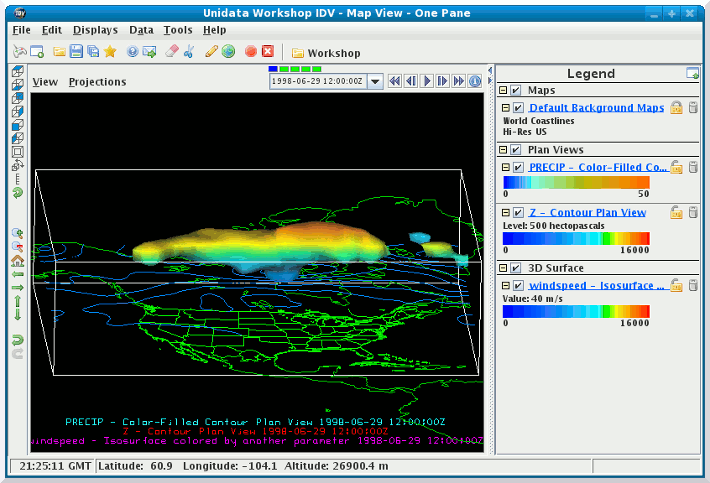
- You can also create isosurfaces of one variable that is colored
by another variable. In this step, you will load in an isosurface
of wind speed again, but this time you will have it colored
by geopotential height.
- In the
Fields panel, expand the
3D grid tab.
Scroll down to the Derived tab to see
a list of derived quantities. Select the
Speed (from GridRelative_u & GridRelative_v)
field.
- In the
Displays panel,
expand the 3D Surface tab and select
Isosurface colored by another parameter
then click the Create Display button.
(you may have to scroll the Displays
pane to find the display selection)
- After you click the
Create Display
button, a dialog will pop up to allow you to select the
Other parameter. From the dialog,
expand the 3D grid
node and select the geopotential height
field and click the OK button.
- Adjust the wind speed value to 40 m/s.
- Start the animation.
- Rotate the display to see the wind speed pods from various angles.
- Stop the animation and return the display back to the first
time in the sequence and the view to the top.
- You can modify the colors the display through the menus
in the control window or legend.
- You can use a different color table to show the variation of
windspeed with altitude. Click on the
default
button next to the Color table label in the
control window to bring up a list of pre-defined
color tables. Select the menu
and choose the menu item
to change to that color table. In a later exercise, you will
learn how to create and modify your own color tables.
- Rotate the display so you are looking at the view from the
south. On the first time-step, the pod of 40 m/s winds bulges
down into the blues of the color table. Place your cursor
at the bottom of this bulge and note the Altitude readout
at the bottom of the main window. It should read about
5000 m.
- Now move your cursor over the color bar in the legend to the
point where the color at the bottom of the bulge is. Notice
that the readout on the color bar is about 5000 m as well.
- Start the animation.
- Rotate the display to see the wind speed pods from various angles.
- Stop the animation and return the display back to the first
time in the sequence.


Unidata IDV Workshop for version 7.0u1 > Accessing and Displaying Data > Working with Gridded Data
 )
to the right of the entry box. Change the isosurface value to
40 m/s.
 )
or by selecting the control's


