

Unidata IDV Workshop for version 7.0u1 > Accessing and Displaying Data > Working with Gridded Data

3.2.8 Probing Gridded Data (continued)
Now, let's look at other probes that can be used with 3D data -
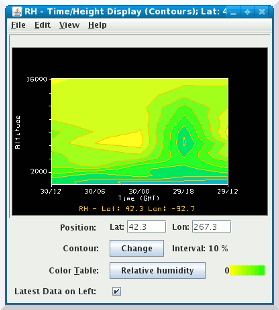
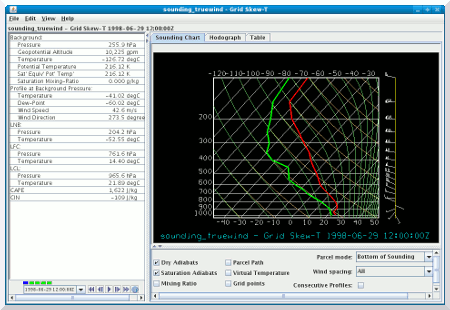
the Time/Height Display and the Grid Skew-T probe. The Time/Height
display will show the variation of a field with height over
time. The Grid Skew-T probe will display a model sounding generated from
the data.
- First, let's create a time/height display of relative humidity.
We'll also load in an isosurface of this field for comparison. You
can load in a probe without displaying the field in the main display.
- If you have not already done so, use the
menu to remove the displays
created in the previous exercise.
- First, we'll load in a time/height display of relative humidity.
In the
Fields panel, expand the
3D grid tab.
Select the relative humidity field.
- In the
Displays panel, select
Isosurface (under the
3D Surface tab). Then, hold the
Ctrl key down and click on
Time/Height Display (Contours)
(under the Probes tab) to select both.
Click the Create Display button.
Once the displays are created, set the isosurface value
to 80% and minimize the isosurface control window.
- Move the probe around to see how relative humidity varies
with time and height at a particular location. Now, move the
probe over Iowa.
- Tilt the main display so you can see the structure of the
relative humidity isosurface at the probe location, then
step through the animation and compare the structure you
see in the isosurface to the structure at the same time
in the time/height display. How do they compare?
- Stop the animation and return to the first time step.
- Now, we'll create a Skew-T display of calculated model parameters.
- In the
Fields panel, expand the
3D grid tab.
Expand the Derived tab and select the
Sounding Data (with true winds) field.
This derived quantity will show up when the grid contains
temperature, dewpoint and wind fields or any of these
that can be derived from others.
- In the
Displays panel, select the
Grid Skew-T display. Click
the Create Display button.
- Undock the
Time/Height and the
Grid Skew-T displays from the Dashboard.
Arrange your windows so you can see the main display, the
SkewT display and the Time/Height display.
- Now, share the probe position with the Time/Height Display.
In each of the control windows, use the
menu to turn on
sharing of the probe position. Move the probe over Iowa slightly
to align the two probes.
- Step through the animation and compare model temperature and
dewpoint profiles with Time/Height display. In regions of
high relative humidity, the temperature and dewpoint profiler
will be close together.


Unidata IDV Workshop for version 7.0u1 > Accessing and Displaying Data > Working with Gridded Data


