- Clear out any existing displays.
- In the
Field Selector'sData Sourcespanel, select theNCEP Model Data ETAdata source. - In the
Fieldspanel, expand the3D gridtab. Select thegeopotential height, theContour Plan Viewdisplay and set theLevelto be 500 hectopascals, then click theCreate Displaybutton. - In the
Fieldspanel, expand the3D gridtab. Scroll down to theDerivedtab and expand that. Select theFlow Vectors (from GridRelative_u & GridRelative_v)field. - In the
Displayspanel, selectWind Barb Plan View, in theLeveltab, select 500 hectopascals, then click theCreate Displaybutton. - The display is pretty cluttered. You can change the skip interval to declutter the display. Try various intervals (found on the 'Display' tab of the dashboard).
- Toggle between vectors and streamlines and play around with the streamline density slider.
- Link the two displays by selecting the
Edit→Sharing→Sharing Onmenu. - Change the level and see how the pattern changes.
- Turn on the time animation.
- Stop the time animation.
- In the
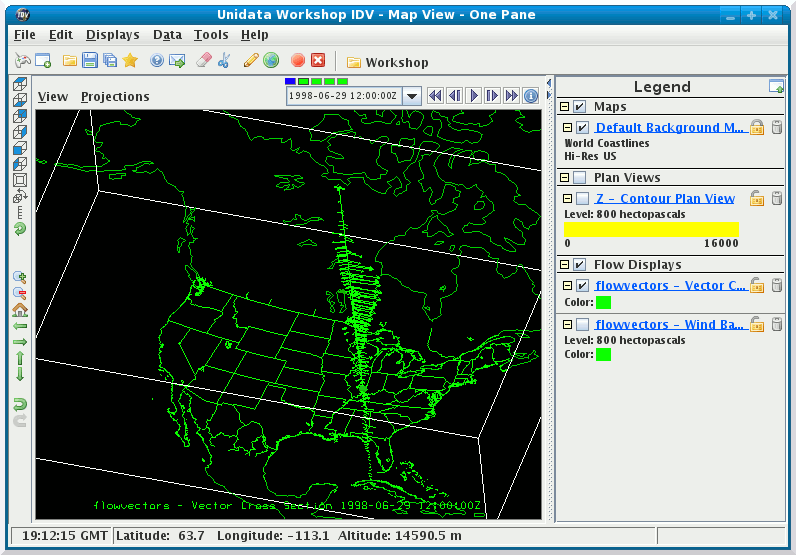
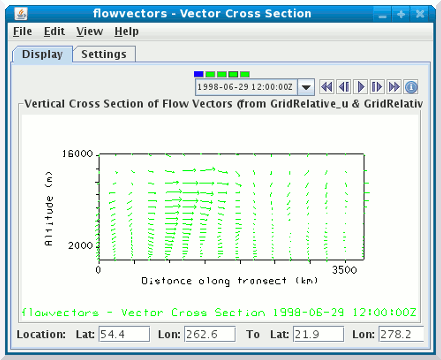
Field Selector'sFieldspanel, select theFlow Vectors (from GridRelative_u & GridRelative_v)field. - In the
Displayspanel of theField Selector, selectVector Cross Sectionand then click theCreate Displaybutton. - Move the cross section around and see how the flow changes.
- Start the animation.


