Edit→Remove All Displays and Data menu item
or the  icon in the toolbar to clear them out.
Data Choosers.  Click on the
 Images node in the chooser tree.Server: selector, choose
adde.ucar.edu.
In the Dataset: selector, choose
CCS039. If either of these is
not in the list, just type them in. When you have made
your selections, click the Connect
button.Image Type: selector, choose
the 1 km GOES-8 Visible type.- Click on the
Absolute timesradio button.When this option is selected, the server is queried for a set of available times for that type and these are listed in the
Times:panel. - Select
 the 7 images from
 1998-06-29 16:15:00Zthrough1998-06-29 22:15:00Z. - Click the
Add Sourcebutton.
In the Data Subset panel, there are Times, Region, and Advanced tabs.
- In the
Regiontab, click on the drop down menu button and by default theUse Default Regionoption is selected. - Click the
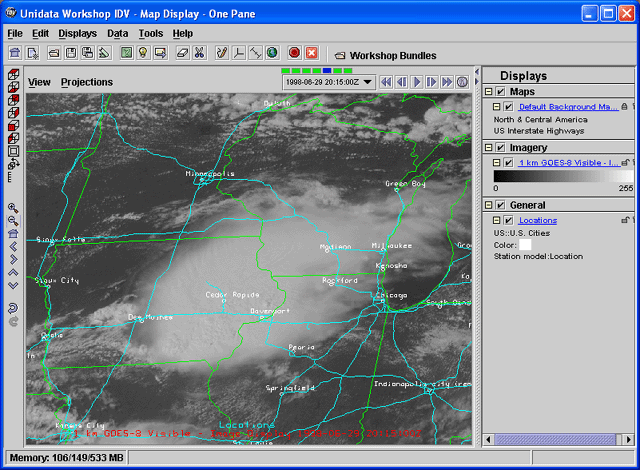
Create Displaybutton. The images created in theMap Viewwindow cover the entire region of the dataset. Zoom in over the super cell in eastern Iowa - Remove the display and keep the data by click
Trashicon in the legend panel - Back in the data subset panel, in the
Regiontab, click on the drop down menu button and choose theSelect A Regionoption. - Draw a bonding box in eastern Iowa with left mouse button and click the
Create Displaybutton. - In the
Map Viewwindow, zoom into the region in eastern Iowa covered with the convective cloud. - Remove the display and keep the data by click
Trashicon in the legend panel, do not change the map view region in theMap Viewwindow. - Back in the data subset panel, in the
Regiontab, click on the drop down menu button and choose theMatch Display Regionoption, click theCreate Displaybutton. - Keep images created in the last spatial subset option.
Default Background Maps Control.
 Turn on the
North & Central America and
the US Interstate Highways maps.
Make sure all other maps are off. When you are finished,
go back to the View Window.Displays→Locations→US→U.S. Cities menu to
overlay some place names. Change the color of the location
text to be white using the display control's
Edit→Color menu.

Pixel Sampling slider
to see what the image would look like at a lower resolution.
- Move the slider to 5 to see the difference an image at 6 km resolution would look like.
- Return the slider back to 0 before proceeding to the next exercise.
- Do not clear this display.


