Reflectivity field and create a
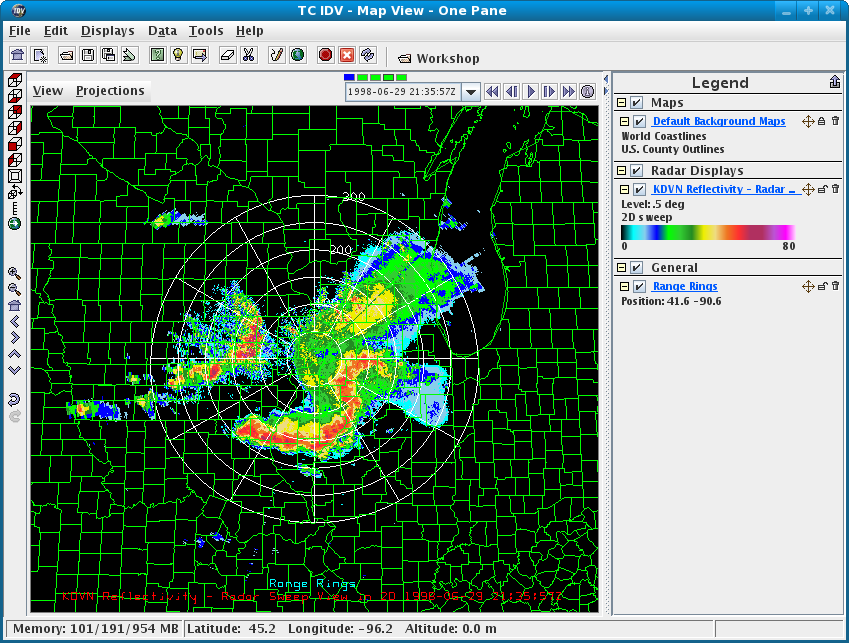
Radar Sweep View in 2D display. A display of
the Level II sweep at the lowest tilt appears in the main window. - In the display's control window use the
Elevation Anglesselector to choose another tilt angle. - Zoom in to see the display character is that of the radar's native coordinate system, with wedge-shaped bins showing the radar range-azimuth coordinates.
- Change the background maps using the
Default Background Maps Control. Put on a map of U.S. Counties in green.
Radar Range Rings- Restore the initial display overhead view with the key combination Ctrl-r.
- Select the
Displays→Special→Range Ringsmenu from theMain Menu Bar. A set of range rings will appear, centered on the radar station. - Use the control widgets to change the spacing and color of the rings, the azimuth lines, visibility, and the labels.

- In the control window
2D Sweep View, select theEdit->Change Parametermenu item. - In the
Choose Parameterpanel, open the data source of interest by clicking on the tab. - Click on the parameter
Radial Velocity, and click theOKbutton. - The display is recreated with the new parameter's data.
- Switch the parameter back to
Reflectivity.
- Add in a
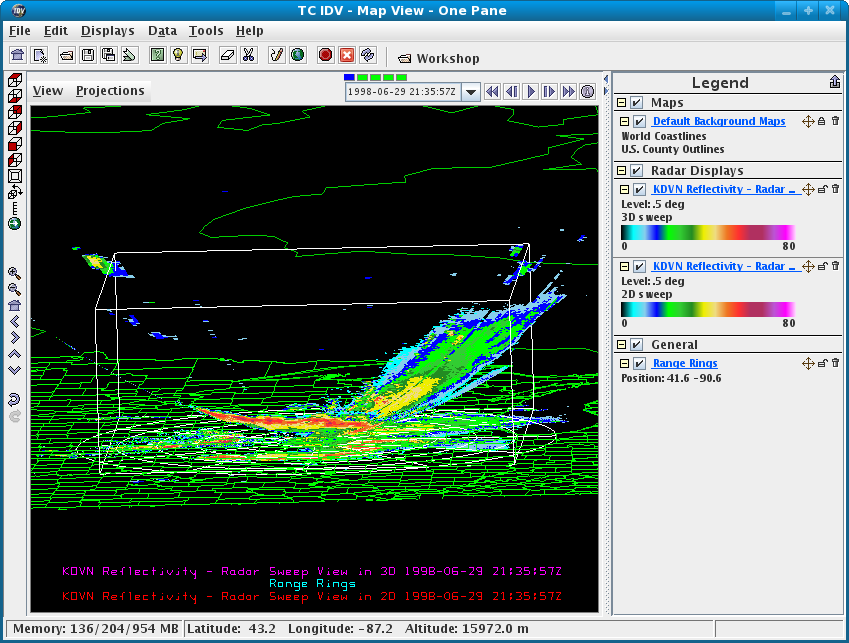
Radar Sweep View in 3DofReflectivity. - The 3D display of the Level II sweep at the
lowest tilt appears in the main window:

- Make sure both
Radar Sweep View in 2Dand theRadar Sweep View in 3Dhave the sameSweep angle. - Rotate and zoom in as needed to see the character of the 3D display, and compare the two displays of the same data.
- If you have time switch the 3D sweep to a high tilt angle. The top of the wireframe box is at 16 km. Judge the maximum height of returned signals. About how far it is from the radar station?
Reflectivity field and create a
CAPPI display.A CAPPI display of the reflectivity will appear in the main window.


