- In the
Data Choosertree click on theFilesnode. - Go to the point data directory:
/data/idv/point/. - Select
metar.csvand pressAdd Source.

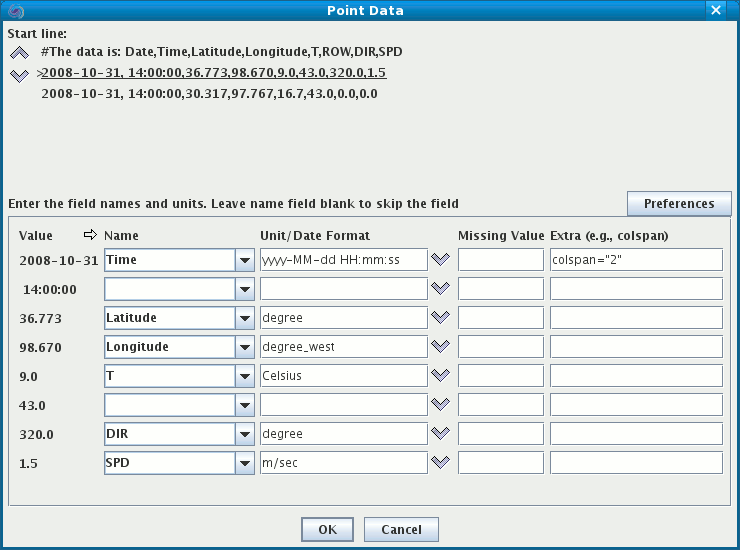
- At the top a number of the initial lines from the text data are shown. The arrow buttons allow you to specify where the data starts. Skip the first line.
- For each column of text data there is a row that shows sample value and allows you to enter a name, unit, date format, missing value and extra information.
- We're going to skip the "ROW" parameter and define metadata for:
"Time ","Latitude", "Longitude", "T", "DIR",and "SPD". - Note that the time field spans two columns - year and time. The IDV needs to have the time in one column so we use:
colspan="2"
This tells the IDV to concatenate columns 1 and 2 and treat them as a single column. - Note: the unit for longitude is "degrees_west"
- Enter the names and units as shown above.
- You can save these settings for future use.
- Press the
Preferencesbutton and selectSave Current. - Enter a name, e.g., "workshop"
- You can reapply these settings with the
Preferencesbutton.
- Press the
- When done press
OK. You can also bring up this GUI in the Data Source Properties Dialog.
Point Data Plot and change its layout model to "METAR"
 (index) -> (Date,Time,Latitude,Longitude,T,DIR,SPD)
  Time[fmt="yyyy-MM-dd HH:mm:ss"],Latitude[unit="deg"],Longitude[unit="degrees west"],T[unit="celsius"],
        skip,DIR[unit="deg"],SPD[unit="m/s"]
  2008-10-31, 14:00:00,36.773,98.670,9.0,43.0,320.0,1.5
  2008-10-31, 14:00:00,30.317,97.767,16.7,43.0,0.0,0.0
  2008-10-31, 14:00:00,34.398,96.148,13.0,43.0,0.0,0.0
  2008-10-31, 14:00:00,28.973,95.863,17.0,43.0,60.0,1.5
  2008-10-31, 14:00:00,45.150,89.150,8.0,43.0,310.0,2.6
           .......
In the example above, the first line's structure is a VisAD type definition.
The second line defines the formatting and units of the parameters.
Starting the third line is the data section of this sample.
There is more documentation in the User Guide.
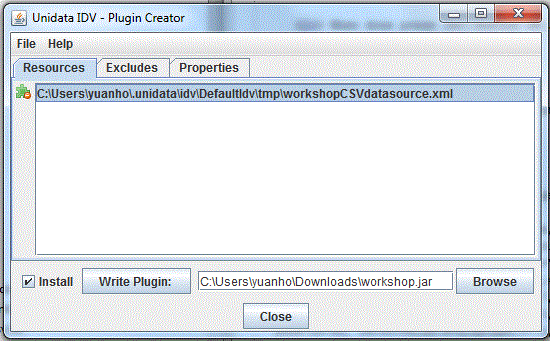
- Press the
Preferencesbutton and selectWrite Data Source Plugin. - Enter a name of type, e.g., "workshopCSV", and a label, e.g., "workshop csv", and click the
OKbutton.
- Enter a plugin name, e.g., "workshop.jar",and check the install box, and click the
Write Pluginbutton.
- When the IDV is restarted, the data type "workshop csv" is showing in the list.


