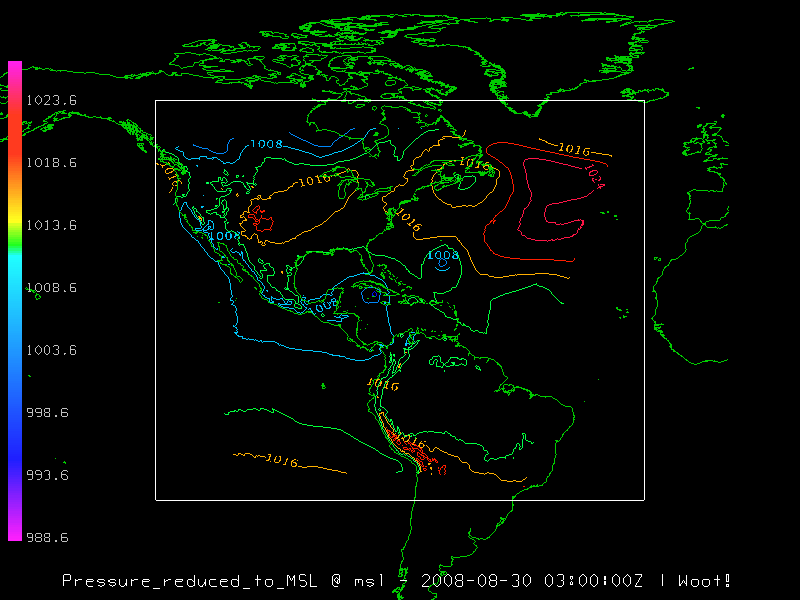


The default display label for a variable can be very useful; however, sometimes it's not so great (as in our case, where the label says "Data - Contour Plan View - timestamp"). Changing the string that composes the label isn't much work, but changing the color of the text requires a bit more care. In order to change the color of the label text, we need to import the Java AWT class Color using import java.awt.Color as Color. The last bit of the import statement (as Color) allows us to refer to the java.awt.Color class by simply using Color (it reduces typing in the end if you have multiple calls to Color).
Built-in to the IDV display label is a macro sub-language. This will allow us to refer to information contained within the datafile, such as longname, shortname, and timestamp, through easy commands like %longname%, %shortname%, and %timestamp%. That said, sometimes the macro for things like %longname% and %shortname% return not-so-informative strings, like "Data" (which is what happens in our example). Not to worry, as you have complete control over the text in the label, as shown in the example below. Note that a list of display name macros can be found in source code for DisplayControlbase and are listed as variables named MACRO_*.
Also included in the example below is a demonstration of how a color scale can be added to your display. Note that all of the work is being done to a ColorScaleInfo object (which we have stored in the variable colorScaleInfo).
|
