

Unidata IDV Workshop for version 7.0u1 > Accessing and Displaying Data > Working with WRF Output > Jython

3.13.1.4 Combining Displays
Adding different displays to your WRF images.
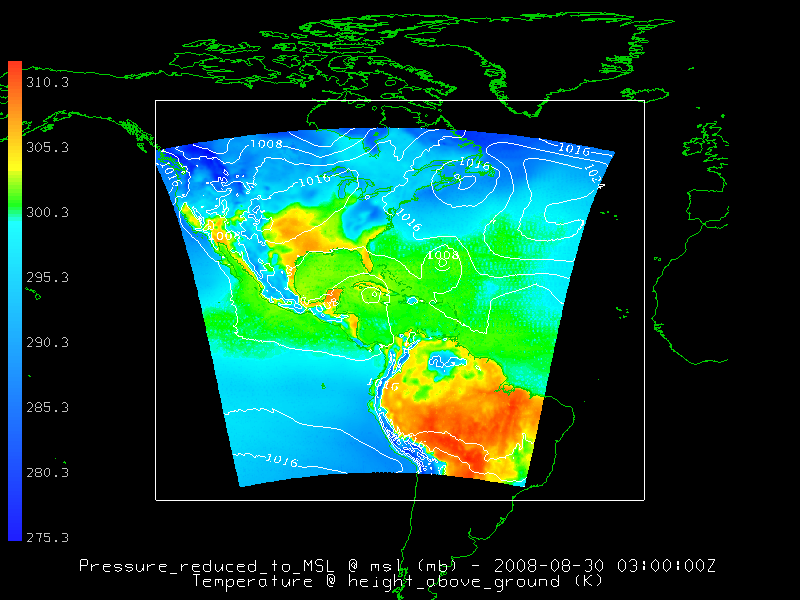
Now that we have basic control over our display, let's add a color-shaded plan view to our contoured display. The following example code is based on the example from the previous section, but has been re-arranged for clarity. Note that we have given each DisplayControl object (dc_contour and dc_shade) a "ZPosition" to ensure that the contours are on top of the color shaded display.
 import java.awt.Color as Color
 #
 # input options
 #
 filename = '../data/wrfprs_d01.057'
 contour_variable = 'Pressure_reduced_to_MSL @ msl'
 shade_variable = 'Temperature @ height_above_ground'
 file_opener = 'file.grid'
 #
 # output options
 #
 display_contour = 'planviewcontour'
 display_shade = 'planviewcolor'
 image_dimensions = (800, 600)
 output_name = 'twoDisplays.png'
 #
 # Generate the image
 #
 # setup the basic view of the IDV
 #
 setOffScreen(1)
 idv.getStateManager().setViewSize(java.awt.Dimension(image_dimensions[0], image_dimensions[1]))
 ctm = idv.getColorTableManager()
 #
 # get data
 #
 ds = makeDataSource(filename, file_opener)
 contour_data = getData(ds.getName(), contour_variable)
 shade_data = getData(ds.getName(), shade_variable)
 #
 # create colorshaded image
 #
 dc_shade = createDisplay(display_shade, shade_data)
 # add label
 label = shade_variable+' (%displayunit%)'
 dc_shade.setDisplayListTemplate(label )
 dc_shade.setDisplayListColor(Color.white)
 dc_shade.setColorTable(ctm.getColorTable('PressureMSL'))
 # add color scale
 colorScaleInfo = dc_shade.getColorScaleInfo()
 colorScaleInfo.setOrientation(colorScaleInfo.VERTICAL)
 colorScaleInfo.setPlacement(colorScaleInfo.LEFT)
 colorScaleInfo.setIsVisible(True)
 dc_shade.setZPosition(0.)
 pause()
 #
 # create contoured image
 #
 dc_contour = createDisplay(display_contour, contour_data)
 dc_contour.setColorTable(ctm.getColorTable('White'))
 # change unit
 old_unit = dc_contour.getDisplayUnit()
 dc_contour.setDisplayUnitName('mb')
 new_range = dc_contour.convertColorRange(dc_contour.getRange(),old_unit)
 dc_contour.setRange(new_range)
 # create label
 label = contour_variable+' (%displayunit%)'
 dc_contour.setDisplayListTemplate(label+' - %timestamp%')
 dc_contour.setDisplayListColor(Color.white)
 dc_contour.displayableToFront()
 dc_contour.setZPosition(1.)
 # render and save image
 pause()
 image = getImage()
 writeImage(output_name)
|


Unidata IDV Workshop for version 7.0u1 > Accessing and Displaying Data > Working with WRF Output > Jython


