


Leveraging the IDV Jython command shell with VisAD creates a powerful combination for scripting IDV workflows as well as "experimental exploration" of data and the IDV and VisAD APIs. In this section, we will examine to how make use of the IDV Jython scripting environment to visualize data interactively.
To achieve this objective, we will leverage the VisAD Jython APIs. Complete documentation for these APIs can be found here:
The JPython (the old name for Jython) VisAD API is a low-level API for interacting with VisAD objects from the Jython environment. The IDV JythonLib is a higher-level API built on top on the VisAD JPython API. In the following exercises we will be using both these APIs.
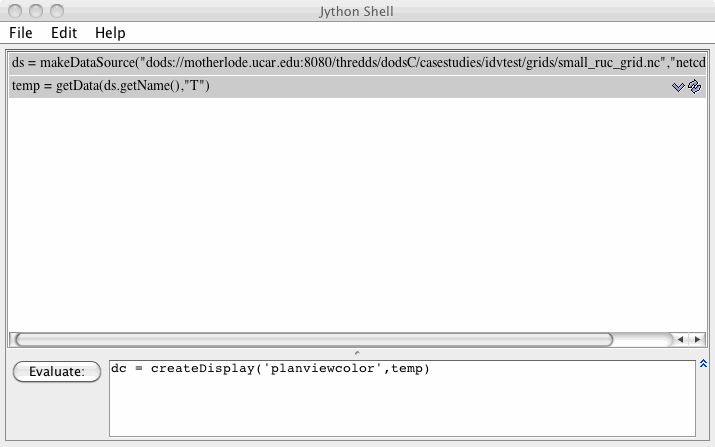
These exercises are meant to be done in sequence. We will be using the Jython interactive shell. Please enter the commands described below in the evaluation area as shown in the figure.
Edit→Remove All Displays and Data menu item
or the  icon in the toolbar to clear them out.
Edit→Formulas→Jython Shell menu item.Evaluate button.
ds = makeDataSource("dods://motherlode.ucar.edu:8080/thredds/dodsC/casestudies/idvtest/grids/small_ruc_grid.nc","netcdf.grid")
temp = getData(ds.getName(),"T")
dc = createDisplay('planviewcolor',temp)
This script should result in a color shaded plan view of temperature data.
rh = selectData()
You will be prompted for data. Select relative humidity.
dc = createDisplay('planviewcolor',rh)
def retrieveData(dset, field) :
  return getData(dset.getName(),field)

def createColorShadedPlanView(field) :
  return createDisplay('planviewcolor',field)
u = retrieveData(ds,"u")
v = retrieveData(ds,"v")
Now invoke the windpeed formula you wrote in an earlier
showLib()
ws = windSpeed(u,v)
dc = createColorShadedPlanView(ws)
If you did not complete that exercises, here is the wind speed formula.
def  windSpeed(u,v):
  usqd= u*u
  vsqd= v*v
  ws = sqrt(usqd + vsqd)
  return ws
If other displays and data are already loaded, select the
Edit→Remove All Displays and Data menu item
or the icon in the toolbar to clear them out.
sds = makeDataSource("/Users/chastang/tmp/sat/GOES-East100.area")
img = selectData()
gds = makeDataSource("http://motherlode.ucar.edu/thredds/dodsC/model/NCEP/NAM/CONUS_40km/conduit/NAM_CONUS_40km_conduit_20110712_1200.grib2")
grid = selectData()
Here you will be prompted for the field. Select Formulas -> Grid -> Make 2D slice, then pick the 300hPa temperature -- one time only!
diff = img - grid
createDisplay('planviewcolor',diff)
Edit→Formulas→Jython Shell menu item.
Note that it is possible to have several shell windows open at once. This is a nice feature as you develop your Jython methods in one shell, then copy / paste the completed method to the fresh shell for export.
    def dew_c(rh, temp_c):
      from java.lang import Math
      l = Math.log(rh / 100.0)
      m = 17.27 * temp_c
      n = temp_c + 237.3
      b = (l + (m / n)) / 17.27
      dew_c = (237.3 * b) / (1 - b)
      return dew_c
File→Export Commands menu item. This action will prompt you for a procedure name, but leave this field blank and click the OK button.Save button. You now have your Jython method available for later use.The VisAD Jython shell is a full programmatic environment. We have only scratched the surface of what can be achieved. We encourage users to interactively experiment with the IDV in this manner.