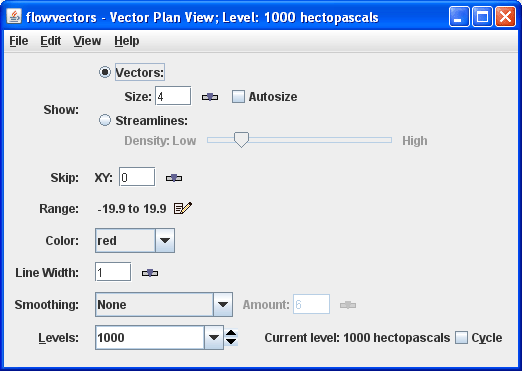
- Vector Size
The length of the vectors can be changed with the
Sizecombo box. This is also an editable box, enter a new size and press return. - Skip interval
To avoid cluttering the display you can define the number of grid points that are skipped with the
Skip intervalcombo box. A skip interval of 0 mean show all grid values, 1 means skip every other one, 2 means show every third one, etc. - Show Streamlines
Click on
Show Streamlinesto toggle between vectors and streamlines. When displaying as stream lines theDensityslider allows you to change the density of the display. - Color
The color button is both the color of the selector point and the color of the vectors in the display.
- Line Width
Set the line width in the display. Click on the
 to change the value.
 - Smoothing
This control has an option to smooth the grid that can be used to smooth contour lines or flow fields for display. There are 6 types of smoothing: 5-point, 9-point and gaussian weighted, Cressman, circular and rectangular aperture smoothers. The amount of smoothness can be set for the gaussian smoother. The higher the amount, the smoother the grid. For the Cressman, circular and rectangular aperture, the factor is the radius in grid spacing units.
- Levels
Click on the
Levelsbox to see a pull down menu of the native grid levels. Click on one level value to reset the plan to that level. The plan level in use is shown in the data's native altitude units. TheLevelsbox is editable. Click in the box, enter a value and hit return to set your own value.Click on the
Cyclecheck box to animate vertically through all available levels.


