- Through the
Edit->Add Parameter...menu. - Through the
View->Parameters->Add Parameter...menu.
-
Remove. Remove the selected parameter.
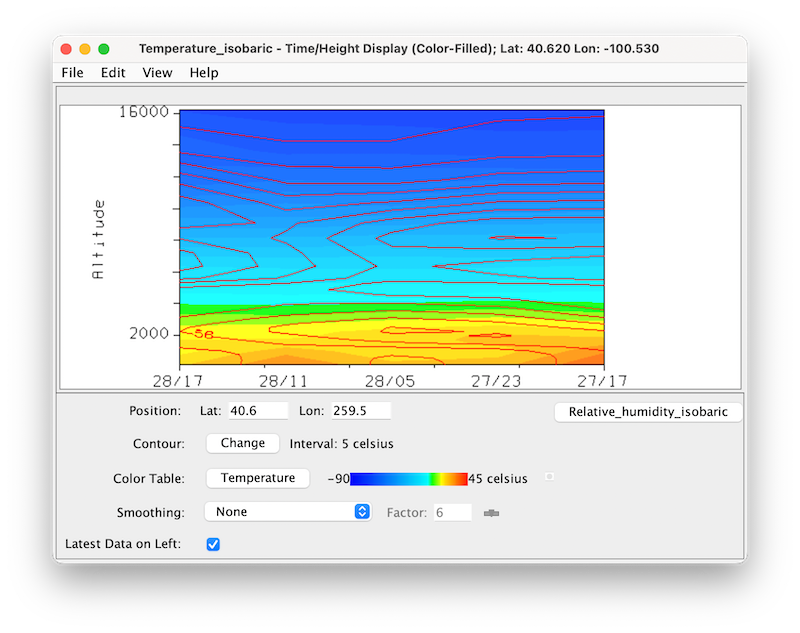
The map position of the profile is shown in the main 3D view window by a colored vertical line. There is a Selector Point on top of the vertical line. You can move the vertical profile line over the map by dragging the Selector Point with the left mouse button. You can zoom in on the display graph by holding down the Shift key and dragging the mouse pointer up while pressing the left mouse button; drag down to zoom out. You can pan the graph by holding down the Ctrl key and dragging the mouse pointer in any direction while pressing the left mouse button.
- Contour
To set contour information use the Contour: Set button, which brings up the Contour Properties Editor.
- Color Table
The control has a color bar showing the active color table and the associated high and low data values in the units the display is made in. As the mouse pointer is moved over the color bar, the value at a particular color is shown. Click on the color bar to start the Color Table Editor. Or click on the button that displays the name of the color table to show a popup menu that allows you to change the range, select other color tables, etc.
- Smoothing
This control has an option to smooth the grid that can be used to smooth contour lines or flow fields for display. There are 6 types of smoothing: 5-point, 9-point and gaussian weighted, Cressman, circular and rectangular aperture smoothers. The amount of smoothness can be set for the gaussian smoother. The higher the amount, the smoother the grid. For the Cressman, circular and rectangular aperture, the factor is the radius in grid spacing units.
- Latest Data on Left
This checkbox reorders the x axis of the display.
- Newly added Parameter
This checkbox is a modal dialog and has all control widgets associated with this newly added parameter.


