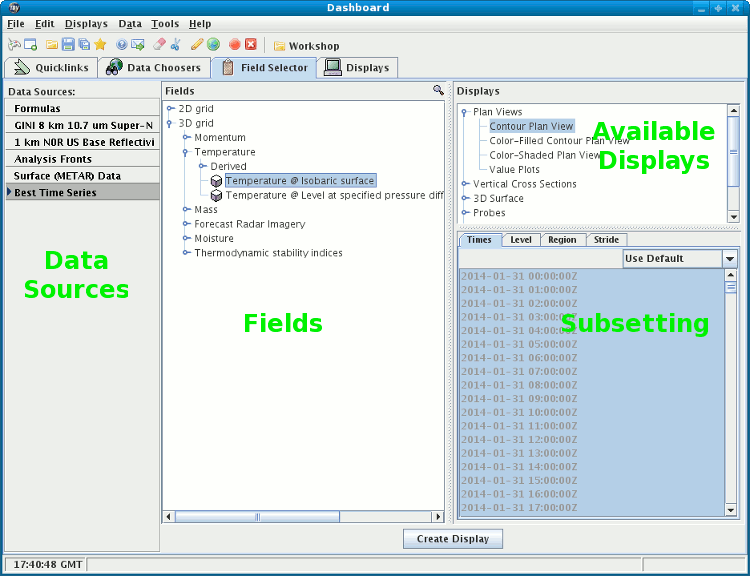
Image 1: Field Selector Window


File->New->Field Selector Window menu.

 |
 |
 |

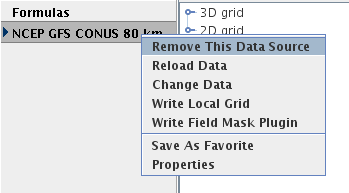
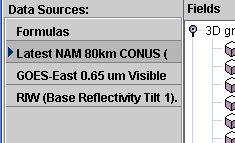
The Save as Quick Link item will save this data source
off as a favorite and make it available in the "Favorite Data Sources"
tab of the Quick Links tab of the Dashboard.
 .
.
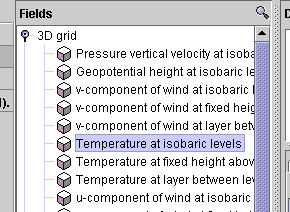
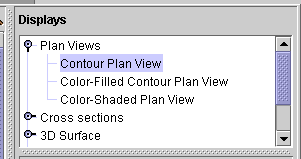
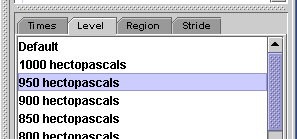
Selecting a field will show the list of displays available in the Displays list and subsetting information (e.g., times, spatial subset).
Time and spatial subsetting defaults can be applied to the data source itself through the Data Source Properties dialog or the defaults can be overwritten through the Field Selector window.
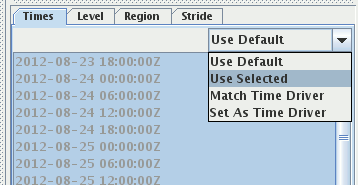
You can subset the times manually by choosing the Use Selected menu item in the drop down menu and
selecting the times. Other options are Match Time Driver and Set As Time Driver.
If a user selects the Match Time Driver menu item, the IDV will check the current active view
window to make sure there is a time driver available. Otherwise, an error message will appear to remind the user
a driver is needed first. When the IDV confirms that a time driver is available, the time list of this dataset will
be removed in the subset panel, and the times used by the time driver in the current active display will be used.
If a user selects the Set As Time Driver menu item, the selected times of this dataset will be used as
the driver times for this view window. Only one time driver is allowed in each view window, and the most recent display
set as the time driver will be used.
You can select two or more displays (different display types) at one time. For an additional display, hold down the CTRL key and click on the second display type desired. Then go ahead and create the display as normal; all selected displays will be made. To make the display click on the button Create display(or double click on the display).
These automatic derived parameters are offered when the required data to compute them are available, based on parameter names.
Since few data sets use the same names for parameters, the IDV keeps of a list of "aliases" or particular parameter names that match with "canonical" names which are generally understood by all IDV users and which the IDV uses for computations. You can add your special parameter names to the list of aliases. Read the Parameter Alias section in this guide for information on using that facility.
All needed source parameters for one derived parameter must come from one single data source, for example, from one single netCDF file. The IDV attempts to find derived parameters that can be made from data in each data source in the data source panel, but not from all possible combination of data sources. If you had separate files of u and v wind components, for example, the parameter names or aliases will not create Derived wind vectors.
You can select a formula just like any other field and create a display from it. However, the formula, when evaluated to create the display, usually needs one or more other data fields to act on. In this case a special Field Selector window is shown that allows the user to select the fields for the formula. (Note: the fields you select here can also be formula fields resulting in further field selection).