Definitions
A forecast model is a scientific model that predicts the time evolution of a system starting from some initial state. Its output is a time series for each of its variables, which may be state variables or derived variables. The model is often run periodically, so one may have a collection of different runs. The collection of data output for a particular model run is called a forecast model run, which may be output in a single file or in several files. The model is run periodically, and so one may have a collection of forecast model runs, which we assume can be uniquely identified by the start of the model run, called the model run time, also called the analysis time or generating time.
The time series for a forecast model run is the list of forecast times, also known as the valid times. For our purposes, the forecast times are just whatever the time series is, ignoring whether its a forecast, nowcast, hindcast, etc. The difference between the run time and the forecast time is the forecast offset, sometimes called the forecast hour.
Grid datasets with two time dimensions
The ucar.nc2.dt.GridDatatype is the CDM scientific datatype for grids.
It has been generalized to allow two time dimensions, called the runtime and time dimensions, in order to represent collections of forecast model runs.
Such a dataset can be created by writing a single file, or by using NcML aggregation to create a virtual dataset out of multiple files.
Both the runtime and time coordinates may have type String or char and hold ISO 8601 dates, or have a udunit date unit string in its units attribute.
For example:
  String runtime(run=3);
     :long_name = "Run time for model";
     :standard_name = "forecast_reference_time";
     :_CoordinateAxisType = "RunTime";

  data:
  "2006-09-05T12:00:00Z", "2006-09-06T12:00:00Z", "2006-09-07T12:00:00Z"
The time coordinate is the forecast (valid) time, and it will differ for each run, and so will be two dimensional:
double time(run=3, time=7);
  :units = "hours since 2006-09-05T12:00:00Z";
  :long_name = "forecast (valid) time";
  :standard_name = "time";
  :_CoordinateAxisType = "Time";

data:
  {90.0, 96.0, 102.0, 108.0, 114.0, 120.0, 126.0},
  {114.0, 120.0, 126.0, 132.0, 138.0, 144.0, 150.0},
  {138.0, 144.0, 150.0, 156.0, 162.0, 168.0, 174.0}
The data variables will generally have both the runtime and time dimensions, as well as the z, y, and x dimensions:
float Dew_point_temperature(run=3, time=7, height_above_ground1=1, y=689, x=1073);
  :units = "K";
  :long_name = "Dew point temperature @ height_above_ground";
A dataset with a runtime dimension and a 2D time dimension as described here is called an FMRC (Forecast Run Model Collection) dataset.
You can open it as an ordinary dataset and manipulate it through the NetcdfFile or NetcdfDataset APIs.
More typically you want to open it as a ucar.nc2.dt.GridDataset, so that the grid variables are found and made into ucar.nc2.dt.GridDatatype objects, and especially so that the time coordinates are found through methods on the ucar.nc2.dt.GridCoordSystem:
public CoordinateAxis1DTime getRunTimeAxis();
public CoordinateAxis1DTime getTimeAxisForRun(int run_index);
Possibly more interesting is to make it into a ucar.nc2.dt.fmrc.ForecastModelRunCollection object, which allows you to view the dataset in several ways.
This option is described in section 4 below.
Aggregating Forecast Model Runs
A common case is that the model output is spread out in multiple files. A special kind of NcML aggregation can be used to create an FMRC dataset.
Case 1: All data for each forecast model run is in a single file
This case is similar to a JoinNew aggregation, in that a new, outer dimension is created, and each file becomes one slice of the new dataset.
<?xml version="1.0" encoding="UTF-8"?>
<netcdf xmlns="http://www.unidata.ucar.edu/namespaces/netcdf/ncml-2.2" enhance="true" > <!-- 1 -->
  <aggregation dimName="runtime" type="forecastModelRunCollection">                     <!-- 2 -->
  <netcdf location="file:/data/ldm/NAM_CONUS_80km/Run_20060910_0000.nc" coordValue="2006-09-10T00:00:00Z" enhance="true" /> <!-- 3 -->
    <netcdf location="file:/data/ldm/NAM_CONUS_80km/Run_20060910_0600.nc" coordValue="2006-09-10T06:00:00Z" enhance="true" />
    <netcdf location="file:/data/ldm/NAM_CONUS_80km/Run_20060910_1200.nc" coordValue="2006-09-10T12:00:00Z" enhance="true" />
  </aggregation>
</netcdf>
- The netcdf element always has
enhance="true", which adds the coordinate systems needed for a GridDataset. - A
forecastModelRunCollectionaggregation is declared, and an outer dimension called runtime will be created. - All the files in the collection are explicitly named, as well as their runtime coordinate values.
The values must be ISO 8601 formatted dates.
The files themselves must contain all the output times from one model run.
The attribute
enhance="true"adds the coordinate systems needed to identify the (forecast) time coordinate.
Equivalently, you can use an NcML scan element:
<?xml version="1.0" encoding="UTF-8"?>
<netcdf xmlns="http://www.unidata.ucar.edu/namespaces/netcdf/ncml-2.2" enhance="true" >
  <aggregation dimName="run" type="forecastModelRunCollection">
    <scan location="/data/ldm/NAM_CONUS_80km/" suffix=".nc" dateFormatMark="Run_#yyyyMMdd_HHmm" enhance="true" /> <!-- 1 -->
  </aggregation>
</netcdf>
- All the files in the directory
/data/ldm/CONUS_80km/, ending in.ncwill be aggregated. The run time coordinate values will be extracted from the filename, using thedateFormatMarkattribute. A runtime dimension and coordinate variable is added, and the time coordinate is made into a 2D coordinate, as required for an FMRC dataset:
double time(run=3, time=11);
  :units = "hours since 2006-09-10T00:00:00Z";
  :long_name = "Coordinate variable for time dimension";
  :standard_name = "time";
  :_CoordinateAxisType = "Time";
This example assumes that all the time coordinates in each of the files have the same units, particularly, hours since 2006-09-10T00:00:00Z.
If that is not the case, then the time values must be read in and adjusted to have a common unit, which is indicated by adding the timeUnitsChange attribute on the aggregation element:
<aggregation dimName="run" type="forecastModelRunCollection" timeUnitsChange="true">
  ...
</aggregation>
When you have a different number of forecast times in each model run, you must also use the timeUnitsChange attribute on the aggregation element.
Case 2: Data for each forecast model run is in multiple files
In this case we can use nested aggregations, the inner aggregation to join the files together that make one run, then an outer aggregation to make the runs into an FMRC dataset. The following is a single FMRC that shows 3 variations on how to do the inner aggregations:
<?xml version="1.0" encoding="UTF-8"?>
<netcdf xmlns="http://www.unidata.ucar.edu/namespaces/netcdf/ncml-2.2" enhance="true">

  <aggregation dimName="run" type="forecastModelRunCollection"> <!-- 1 -->

    <netcdf coordValue="2006-09-10T00:00:00Z">         <!-- 2 -->
      <aggregation dimName="Time" type="joinExisting"> <!-- 3 -->
        <netcdf location="file:/data/ldm/NAM_CONUS_80km/Run_20060910_0000/Hour_F00.nc" coordValue="0"/> <!-- 4 -->
        <netcdf location="file:/data/ldm/NAM_CONUS_80km/Run_20060910_0000/Hour_F03.nc" coordValue="3"/>
        <netcdf location="file:/data/ldm/NAM_CONUS_80km/Run_20060910_0000/Hour_F06.nc" coordValue="6"/>
      </aggregation>
    </netcdf>

    <netcdf coordValue="2006-09-10T06:00:00Z">         <!-- 5 -->
      <aggregation dimName="Time" type="joinExisting">
        <scan location="/data/ldm/NAM_CONUS_80km/Run_20060910_0600/" suffix=".nc" />                    <!-- 6 -->
      </aggregation>
    </netcdf>

    <netcdf coordValue="2006-09-10T12:00:00Z">         <!-- 7 -->

      <variable name="Time" shape="Time" type="int">   <!-- 8 -->
 	    <attribute name="long_name" value="Forecast Time"/>
        <attribute name="units" value="hours since 2006-09-10T12:00:00Z"/>
        <attribute name="_CoordinateAxisType" value="Time"/>
        <values start="0" increment="1"/>
      </variable>

      <aggregation dimName="Time" type="joinExisting">
        <scan location="/data/ldm/NAM_CONUS_80km/Run_20060910_1200/" suffix=".nc" />
      </aggregation>
    </netcdf>

  </aggregation>
 </netcdf>
- The outer
forecastModelRunCollectionaggregation is declared. It will consist of the nested datasets. - The first inner dataset has a run time coordinate of
2006-09-10T00:00:00Z. - The aggregation will join on the existing dimension called
Time. - Each file is explicitly listed, along with its coordinate value for the forecast time. Since only one value is listed, the files must have only one forecast time coordinate.
- The second inner dataset has a run time coordinate of
2006-09-10T06:00:00Z. - All the files in the directory
/data/ldm/NAM_CONUS_80km/Run_20060910_0600/, ending in.ncwill be aggregated. The time coordinate values must be found in each file’s time coordinate variable. - The third inner dataset has a run time coordinate of
2006-09-10T12:00:00Z. - The coordinate variable for the aggregation dimension is defined, and given attributes and values. The datasets will be sorted alphanumerically, and they must be 1 hour apart.
Case 3: Data for each forecast model run is in multiple files, with one forecast time per file
In the case where the data has a single time step in each file, and we can figure out the runtime and forecast time from each file’s pathname, we can use a special aggregation type called forecastModelRunSingleCollection, and a special form of the scan element called scanFmrc.
<?xml version="1.0" encoding="UTF-8"?>
<netcdf xmlns="http://www.unidata.ucar.edu/namespaces/netcdf/ncml-2.2">

  <aggregation dimName="run" type="forecastModelRunSingleCollection" timeUnitsChange="true" > <!-- 1 -->

    <scanFmrc location="/data/nc/rtmodels/" regExp=".*_nmm\.NcF[0-9]{5}$"
      runDateMatcher="yyMMddHH#_nmm.NcF#"
      forecastOffsetMatcher="#_nmm.NcF#HHH"/> <!-- 2, 3, 4 -->
  </aggregation>
</netcdf>
- The aggregation is declared as type
forecastModelRunSingleCollection, whose forecast time units vary. - All the files in
/data/nc/rtmodels/whose full pathname matches the regular expression.*_nmm\.NcF[0-9]{5}$are used. - The files will be grouped by run date by extracting the run date from the filename using the
runDateMatcherpattern. - Within each run, the
forecastOffsetwill be extracted using theforecastOffsetMatcherpattern.
In this example, the files are named along the lines of 06091212_nmm.NcF03000.
The regular expression ensures that only files that have a literal _nmm.NcF in the name, followed by exactly 5 digits, and nothing afterwards, will be used.
The runDateMatcher matches the literal _nmm.NcF in the file’s full pathname, then applies the java.text.SimpleDateFormat yyMMddHH to the 8 characters that come before the match, to derive the run date coordinate.
The forecastOffsetMatcher also matches the literal _nmm.NcF, then turns the 3 characters after the match into a double, to calculate the hour offset from the run date.
Another example:
<scanFmrc location="C:/data/rap/" suffix=".nc" subdirs="true"
  runDateMatcher="yyyyMMddHH#/wrfout_d01_#"
  forecastDateMatcher="#/wrfout_d01_#yyyy-MM-dd_HHmm"/>
- Works on the files in the directory
C:/data/rap/and its subdirectories that end in.nc. - These files are named along the lines of
C:/data/rap/2006070611/wrfout_d01_2006-07-06_080000.DPG_F.nc. - The
runDateMatchermatches the literal/wrfout_d01_in the file’s full pathname, then applies theSimpleDateFormatyyyyMMddHHto the 10 characters that come before the match, to derive the run date coordinate. - The
forecastDateMatcheralso matches the literal/wrfout_d01_, then applies theSimpleDateFormatyyyy-MM-dd_HHmmto the 15 characters that come after the match, to derive the forecast time coordinate. Note that in thisforecastDateMatcherexample, the-and_characters are literals, and the other charactersy,M,d,Hare special characters that match year, month, day and hour numbers, respectively. The dates are assumed to be GMT unless otherwise specified. See java.text.SimpleDateFormat for more details of how date matching works.
Notes common to all cases:
A Variable that is also a Coordinate will not be promoted to use the runtime dimension, unless you explicitly tell it to do so, for example:
<netcdf xmlns="http://www.unidata.ucar.edu/namespaces/netcdf/ncml-2.2">
 <aggregation dimName="runtime" type="forecastModelRunCollection" recheckEvery="10min" timeUnitsChange="true">
   <variableAgg name="my_vertical_coord"/>
   <scan location="test" dateFormatMark="ncom_glb_reg7_#yyyyMMdd" subdirs="false"/>
 </aggregation>
</netcdf>
Forecast Model Run Collection
If you wrap an FMRC dataset in a ucar.nc2.dt.fmrc.ForecastModelRunCollection, you can then create different views of the dataset that all have 1D time coordinates.
You might use a FmrcImpl constructor, an implementation of the ForecastModelRunCollection interface:
public FmrcImpl(String location);
public FmrcImpl(NetcdfDataset ncd);
You can then extract the following views of the dataset from the ForecastModelRunCollection object:
public List getRunDates();  // possible run dates; List<Date>
public NetcdfDataset getRunTimeDataset( Date runTime);  // one model run

public List getForecastDates(); // possible forecast dates; List<Date>
public NetcdfDataset getForecastTimeDataset( Date forecastTime); // constant forecast date
public List getForecastOffsets(); // possible forecast offsets; List<Double>
public NetcdfDataset getForecastOffsetDataset( double offset); // constant forecast offset
public NetcdfDataset getBestTimeSeries( );
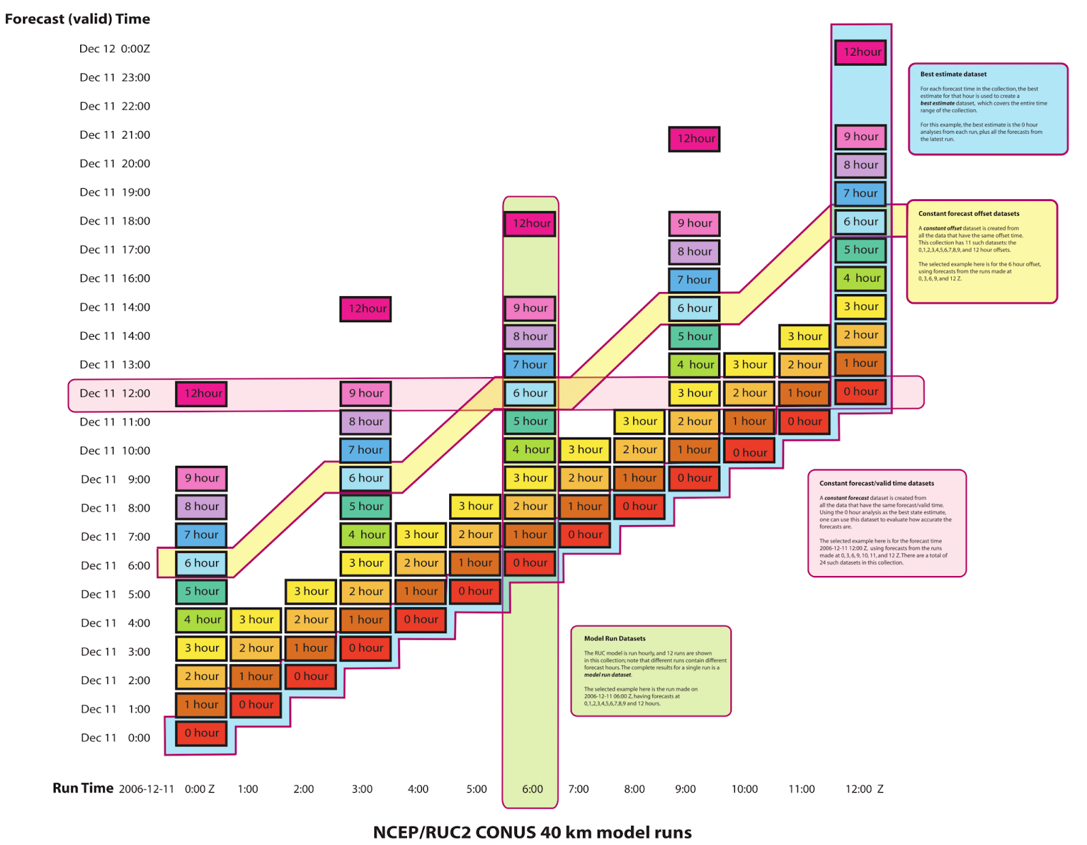
- The
getRunTimeDataset()method will return a forecast model run dataset representing one of the vertical columns in Figure 1. - The
getRunDates()method returns a list of the valid run times. - The
getForecastTimeDataset()method will return a constant forecast date dataset representing one of the horizontal rows in Figure 1. - The
getForecastDates()method returns a list of the valid forecast times. This kind of dataset has successively shorter forecasts of the same endpoint. The final timestep is a nowcast (whereT=0for the run). - The
getForecastOffsetDataset()method will return a constant forecast offset dataset representing one of the diagonals in Figure 1. - The
getForecastOffsets()method returns a list of the valid forecast offsets, normally in units of hours. For example, in Figure 1, you might compare the nowcast dataset (offset = 0, purple diagonal) from the 3 day forecast dataset (dark blue diagonal), to track how well the model does in its 3 day forecasts. - Finally, the
getBestTimeSeries()method creates thebesttime series over the collection. In Figure 1 it will include the nowcasts (purple diagonal) as well as the latest model forecasts (rightmost column).