Unidata IDV Workshop for version 6.1u1 > Accessing and Displaying Data > WSR-88D Level II Data Displays

3.5.1 Level II Sweep Displays in 2D and 3D
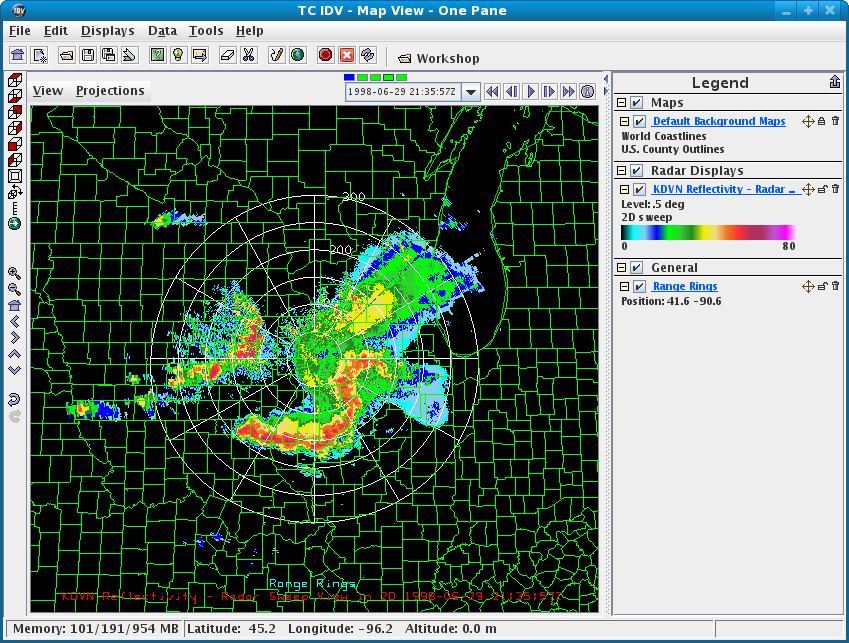
Sweep displays
simulate conventional PPI radar plots of a single sweep of a map view, and
also plot sweeps in the upper atmosphere,
If necessary, select Level II data and times as described in
Accessing WSR-88D Level II Radar Data.
- Select the
Reflectivity field and create a
Radar Sweep View in 2D display. A display of
the Level II sweep at the lowest tilt appears in the main window.
- Move to a new tilt angle in the volume scan; and put up
counties map.
- In the display's control window use the
Elevation Angles
selector to choose another tilt angle.
- Zoom in to see the display character is that of the radar's native
coordinate system, with wedge-shaped bins showing the
radar range-azimuth coordinates.
- Change the background maps using the
Default Background Maps Control.
 Put on a map of U.S. Counties in green.
- Add
Radar Range Rings
- Restore the initial display overhead view
with the key combination Ctrl-r.
- Select the menu
from the
Main Menu Bar.
A set of range rings will appear, centered on the radar station.
- Use the control widgets to change the spacing and color of the rings,
the azimuth lines, visibility, and the labels.
- Change the parameter (radar data moment) in the display.
- In the control window
2D Sweep View, select the
menu item.
- In the
Choose Parameter panel, open the data source
of interest by clicking on the tab.
- Click on the parameter
Radial Velocity, and
click the OK button.
- The display is recreated with the new parameter's data.
- Switch the parameter back to
Reflectivity.
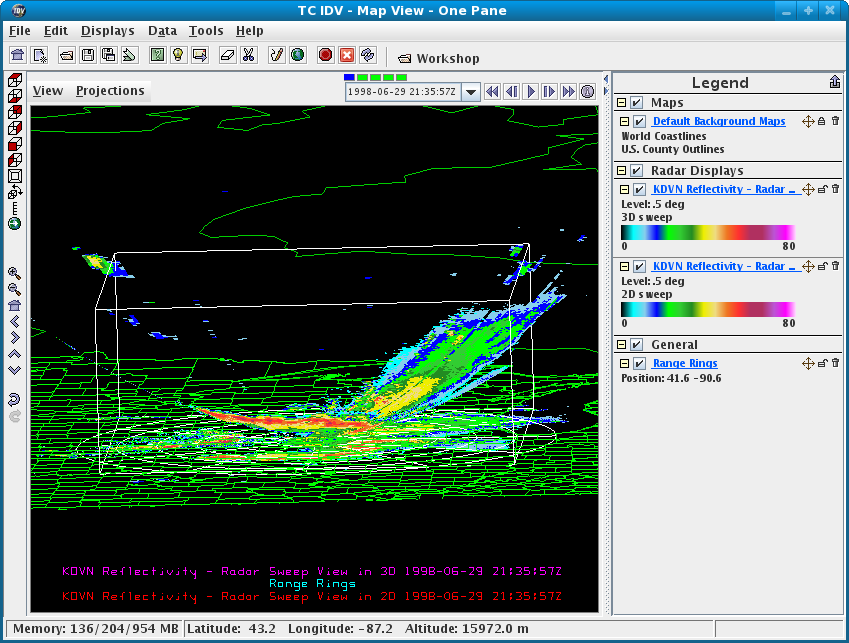
- 3D Sweep display
- Add in a
Radar Sweep View in 3D
of Reflectivity.
- The 3D display of the Level II sweep at the
lowest tilt appears in the main window:
- Make sure both
Radar Sweep View in 2D
and the Radar Sweep View in 3D
have the same Sweep angle.
- Rotate and zoom in as needed to see the character of the
3D display, and compare the two displays of the same data.
- If you have time switch the 3D sweep to a high tilt angle.
The top of the wireframe box is at 16 km. Judge the maximum height
of returned signals. About how far it is from the radar station?
- Remove all displays.
- Display the reflectivity as a Constant Altitude PPI (CAPPI).
Select the
Reflectivity field and create a
CAPPI display.
A CAPPI display of the reflectivity will appear in the main window.
Unidata IDV Workshop for version 6.1u1 > Accessing and Displaying Data > WSR-88D Level II Data Displays