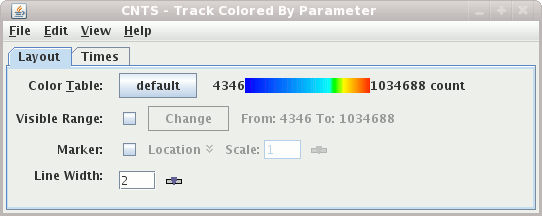
- Color Table
The control has a color bar showing the active color table and the associated high and low data values in the units the display is made in. As the mouse pointer is moved over the color bar, the value at a particular color is shown. Click on the color bar to start the Color Table Editor. Or click on the button that displays the name of the color table to show a popup menu that allows you to change the range, select other color tables, etc.
- Visible Range
The
Visible Rangeallows you to set the range of data values that are shown for the particular field. - Time Mode
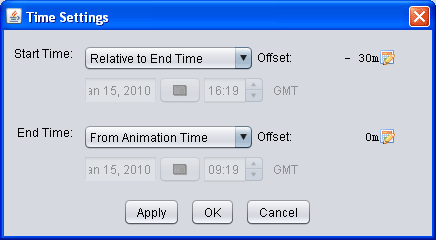
Even though a track represents a set of observation times there is no time set defined for animating in the main display. The time mode allows for the control of how much of the track is shown and from what time. Select the
 button to show the
Time Settingsdialog:This dialog allows you to define the time range of the track to show. The image above defines that the end time is the current animation time. The start time is relative to the end time less 30 minutes.
This time setting is similar to that used for the general time animation.
- Times to Use
You can either use the single nominal time of the track or all the times in the track to define the animation times.
- Show Every
This field allows you to subset the data that is being displayed by only showing every N minutes. For tracks that contain many times you can use this field to subset the times.
Note: If you are displaying track data that has a large number of times you will be prompted whether you want to view all of the times. If Yes then this is automatically set.
- Marker
You can define an end point marker using a layout model. Click the check box to enable this feature.
- Scale
You can scale up or down the size of the marker with this field.
- Line Width
This slider allows you to set the width of the displayed trajectory line. Or type a new value into the text field.


