Overview
The Probsevere(NCEP)/GeoJson control is a subset of drawing contorl that provides an interface to
view collections of ProbSevere Statistical models output that provide probabilistic guidance
to forecasters on the likelihood of severe weather occurrence for convection in the near term.
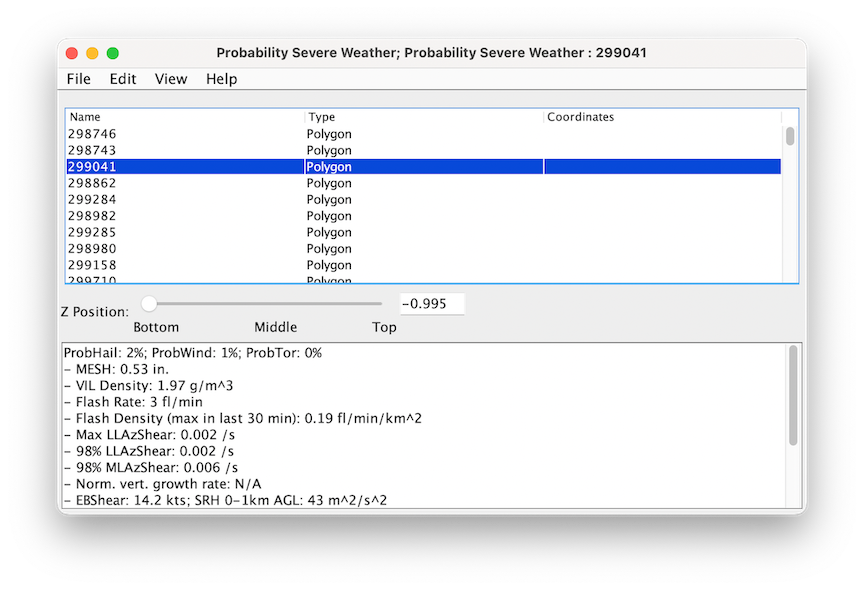
The user interface is composed of table and text note panel.
The selection of each glyph of the table will post the associated properties to the
note text area and the glyph is also highlighted in the view window.
Once glyphs of the severe weather occurrence areas have been created in the view window:
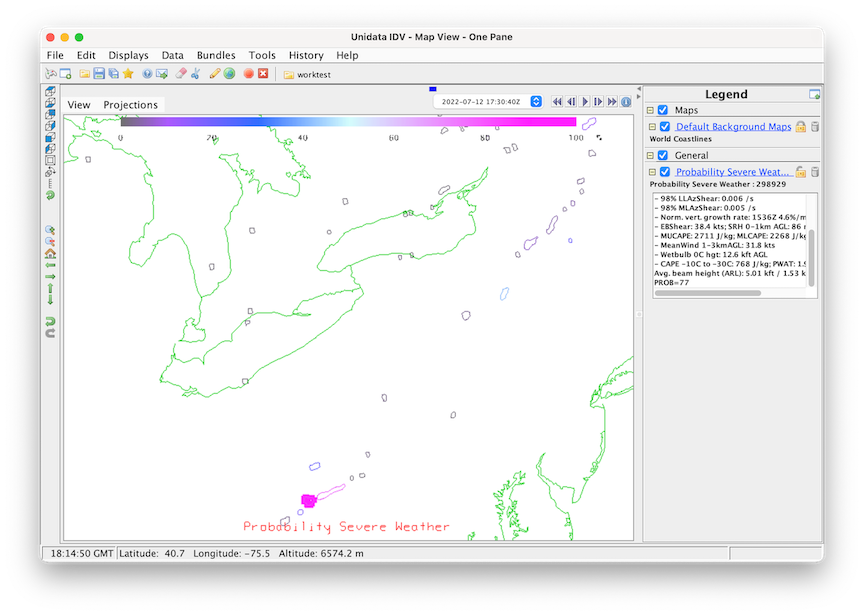
You can select the desired glyph in the view window to check the properties associated, the id of
the selected glyph will be shown in the legend and there is
another text note panel can be added to the legend area by selecting the option
menu items.
You can add the color table to the display window through the
and select the Visble checkbox in the Color Scale tab.
Note: Since the color table is special designed for this data, the user can not change the color
table or the range of the color table.


/Background Image Control")


 Unidata's Integrated Data Viewer > Display Controls > Miscellaneous Controls