Previous: Globe Display Next: Choosing Data Sources Table of contents Images Frames Unidata's Integrated Data Viewer

3 Dashboard
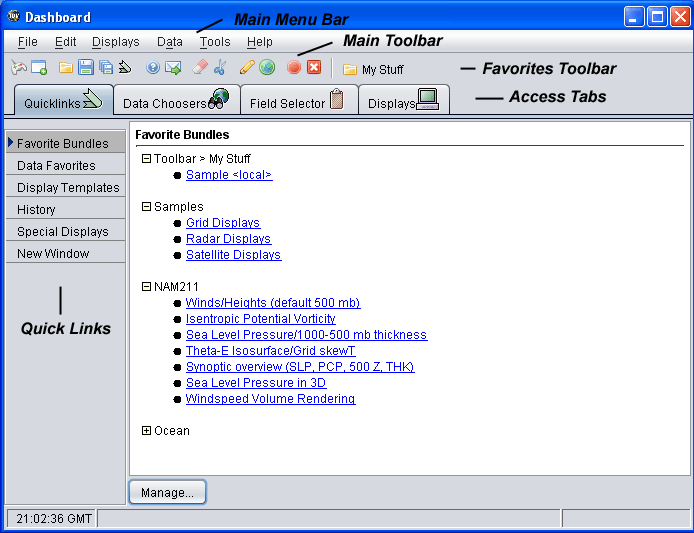
The IDV Dashboard window contains many of the common non-view windows:
IDV Dashboard
Image 1: IDV Dashboard
You can define what components are shown in the Dashboard through the "Dock in Dashboard" preferences.
3.0 Quick Links
The Quick Links tab contains a set of sub-tabs that allow for quick access to various features of the IDV. All of these features can also be accessed through the menu bar.

The Favorite Bundles, Favorite Data Sources, and Display Templates tabs list these different resources. See here for more information. These can also be accessed through the Displays->Favorite Bundles, Displays->Display Templates and Displays->Data Sources menus.

The History tab lists the last 20 (or so) data sources and bundles that you have loaded. This can also be accessed through the File->History menu.

The Special Displays tab allows you to create the Special displays (i.e., those that do not need data, e.g., Drawing Control, Range & Bearing, etc.). These can also be accessed through the Displays->Special menu.

The New Window tab lists the available windows. These can also be accessed through the File->New->View Window menu.
3.1 Data Chooser
See here for more information.
3.2 Field Selector
See here for more information.
3.3 Display Controls
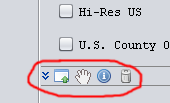
The Display Controls tab holds the Display Control windows. For each Display Control there is a small toolbar at the bottom of the tab:
Dashboard Toolbar
Image 2: Dashboard Toolbar
This allows you to expand the window in the tab, undock the window from the Dashboard and remove the Display Control.

Once a Display Control window is undocked from the Dashboard it can be re-docked through the View->Dock in Dashboard menu item.


Previous: Globe Display Next: Choosing Data Sources Table of contents Images Frames Unidata's Integrated Data Viewer