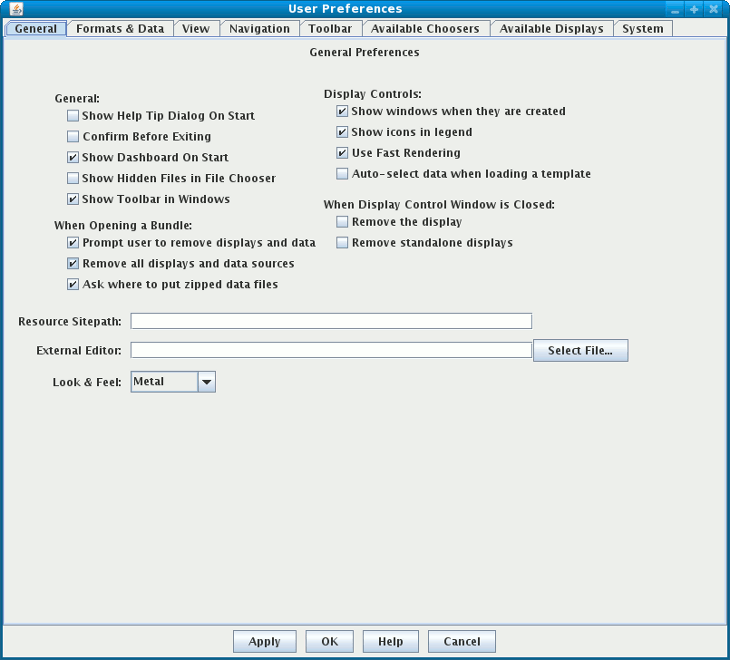
Image 1: General Preferences


Edit->Preferences.
Note: Some of these preferences only take effect the next time you run the IDV or when you create a new view window. The preferences also may be overwritten when you use bundles. See here for more information about the bundle facility.

Show Help Tip Dialog On Start. Should the help tip window be shown at start up.
Confirm Before Exiting. Ask user to confirm before the application exits.
Show Dashboard On Start. Should the dashboard window be shown when the IDV starts.
Show Hidden Files in File Chooser. Should the file choosers show hidden files.
Show Toolbar in Windows. Should the main toolbar (actions and Toolbar Favorite Bundles) be shown in new windows.
Prompt user to remove displays and data. Allows you to control if the prompt dialog is shown before a bundle is opened.
Remove all displays and data sources. Allows you to specify that before a bundle is loaded should all the existing data and displays be removed.
Ask where to put zipped data files. When opening a data bundle (zidv), should the user be prompted where to save the data files?
Show windows when they are created. Specifies that when a display is created its control window is automatically shown.
Show icons in legend. If this is unchecked, the remove and lock icons will not be displayed in the legend.
Use Fast Rendering. Should the displays always use fast rendering. This allows for faster display rendering at the risk of incorrect displays (e.g., when display lines cross projection seams).
Auto-select data when loading a template. A display can be saved as a template without data. When it is created should the IDV attempt to automatically select the appropriate data fields.
Remove the display. Specifies that when a display's window is closed then the display itself is removed.
Remove standalone displays. When the window is closed for a stand alone display (i.e., one that does not have a display component in a main view window. e.g., html display) should the display be removed.
Resource Sitepath. Allows you to define where the IDV looks for additional resources. Use this when you want to have a set of resources shared by a group of users. See the Site Configuration documentation for more details.
Look and Feel. Define the Java look and feel to use. This will take effect when you next run the IDV.
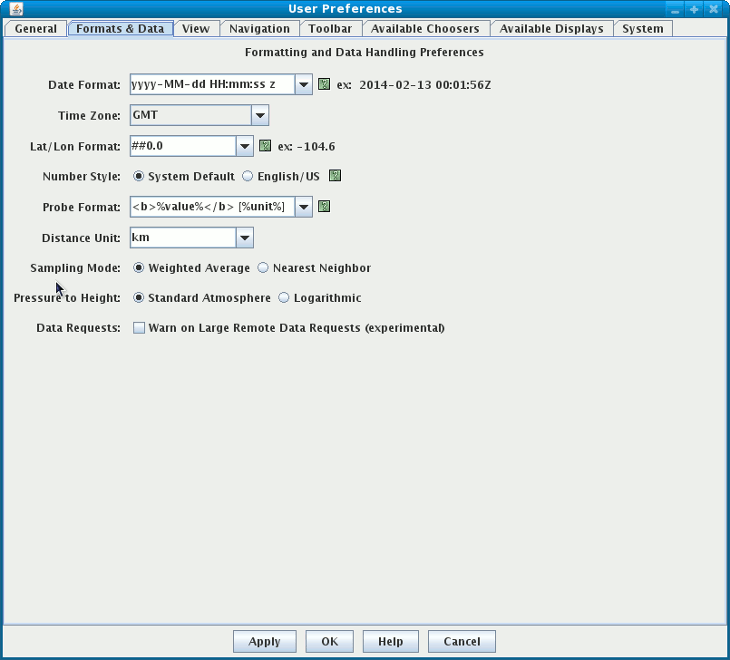
Date Format. This allows you to define how the IDV displays dates. The date format string uses the following symbols. Note, these symbols can be repeated to give different results. For example:
"MMMM" gives full month name
"MMM" gives short month name
"MM" gives  2 digit month number
"M" gives  1 or 2 digit month number
| Symbol | Description | Example |
| G | Era designator | AD |
| y | Year | 1996; 96 |
| M | Month in year | July; Jul; 07 |
| w | Week in year | 27 |
| W | Week in month | 2 |
| D | Day in year | 189 |
| d | Day in month | 10 |
| F | Day of week in month | 2 |
| E | Day in week | Tuesday; Tue |
| a | Am/pm marker | PM |
| H | Hour in day (0-23) | 0 |
| k | Hour in day (1-24) | 24 |
| K | Hour in am/pm (0-11) | 0 |
| h | Hour in am/pm (1-12) | 12 |
| m | Minute in hour | 30 |
| s | Second in minute | 55 |
| S | Millisecond | 978 |
| z | Time zone | Pacific Standard Time; PST; GMT-08:00 |
| Z | RFC 822 Time zone | -0800 |
Time Zone. Choose the time zone to display time with.
Lat/Lon Format. Format used when showing lat/lon. This is a normal decimal format that can contain the symbols:
| 0 | |
| Digit | |
| # | Digit, zero shows as absent |
| . | Decimal separator or monetary decimal separator |
| - | Minus sign |
| , | Grouping separator |
| E | Separates mantissa and exponent in scientific notation. |
| ; | Subpattern boundary Separates positive and negative subpatterns |
Number Style. Choose the formatting style for numbers such as the lat/lon readout and color table range. System Default uses the default regionalization set for your computer. English/US uses a period for the decimal separator. You need to restart the IDV for this to take effect.
Probe format.
This defines an html template that is used to display data readouts in
the data probe display. This html template can contain macros that are replaced
with the probed values.
Macros are:
%value% Formatted value
%unit% Display unit
%rawvalue% Unformatted value
%rawunit% Original unit
Distance Unit. When displaying distances (e.g., in the Range and Bearing Control) this is the default unit that is used.
Sampling Mode. You can specify the type of sampling you want for the various data probes. Choose between a weighted average sampling or nearest neighbor.
Pressure to Height. You can specify the type of algorithm you want to use for converting from pressure coordinates to height. See the FAQ for more information on this option.
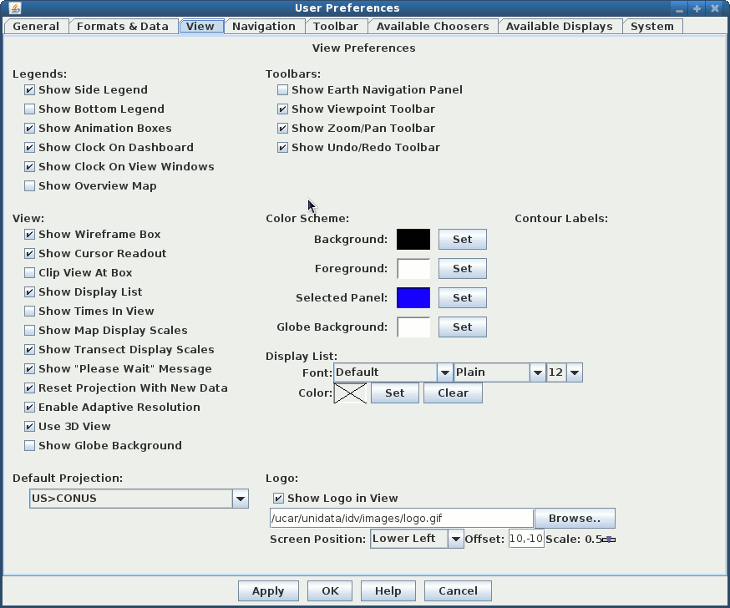
Show Side Legend. Do you prefer the side display legend.
Show Bottom Legend. Do you prefer the bottom display legend.
Show Animation Boxes. Do you prefer seeing the animation boxes in the time animation control.
Show Overview Map. A 3D display can have a small overview map shown under the legend. Note: This is kind of flaky.
Show Wireframe Box. Toggles the visibility of a 3D wireframe box around the data. This box helps provide orientation in 3D views.
Show Cursor Readout. Display a label of latitude, longitude, and altitude of the cursor position over the display, shown in the lower border of the view window.
Clip View At Box. Allows you to elide from view all display elements outside the wireframe box. This is helpful to remove map lines outside the area of data.
Show Display List. Should a listing of the titles and times of the display controls be shown in the main view window.
Show Times In Display. Turn on the label, shown inside the main display, that shows the current animation time.
Show Map Display Scales. Show vertical and horizontal scales in the map displays.
Show TransectDisplay Scales. Show a vertical scale in the transect displays.
Show "Please Wait" Message. Display the "Please Wait" message in the display.
Reset Projection With New Data. When checked will cause each new display made in the IDV to snap the whole view window to the native projection of the data. This can be undesirable if you are overlaying several kinds of some of which have differing projections.
Enable Adaptive Resolution. When loading large datasets with this option enabled, the IDV calculates the resolution of the map view window, dynamically sets the data sampling, and loads sufficient data to generate the image.
Use 3D View. Allows you to override the default 3D behavior of the IDV and use a 2D View for Map Views.
Show Globe Background. In a globe display, show a solid background if this is selected. The default color of the background can be set in the Color Scheme section.
Show Earth Navigation Panel. Show a graphical navigation panel.
Show Viewpoint Toolbar. Enable the Viewpoint toolbar.
Show Zoom/Pan Toolbar. Enable the Zoom/Pan toolbar.
Show Undo/Redo Toolbar. Enable the Undo/Redo toolbar.
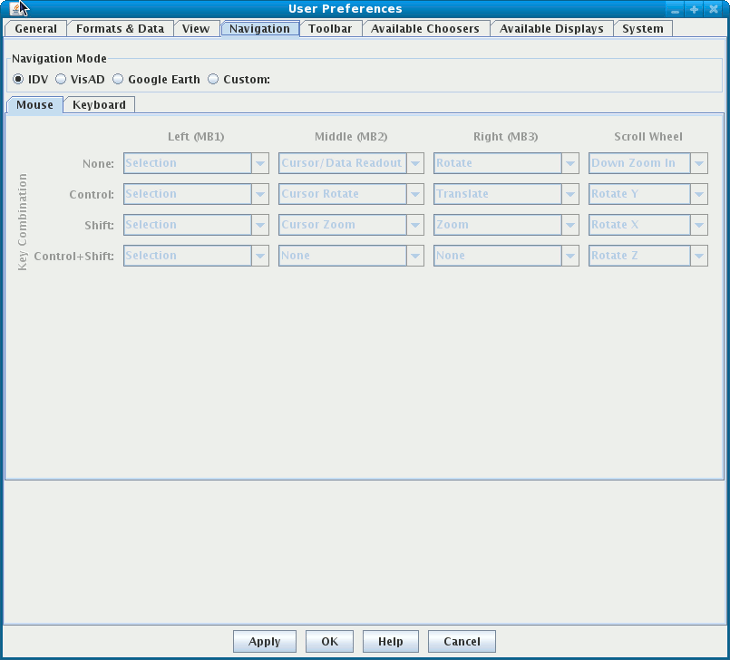
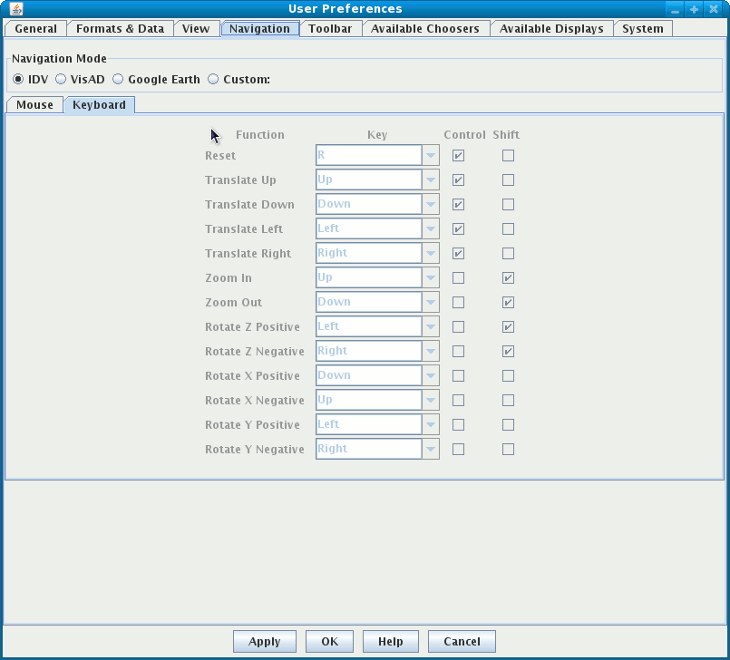
Add space button adds a space
between toolbar entries. The Reload Original resets the toolbar
list to the one before any changes have been made.
The Reload System button resets the toolbar list to
the original one defined in the system.
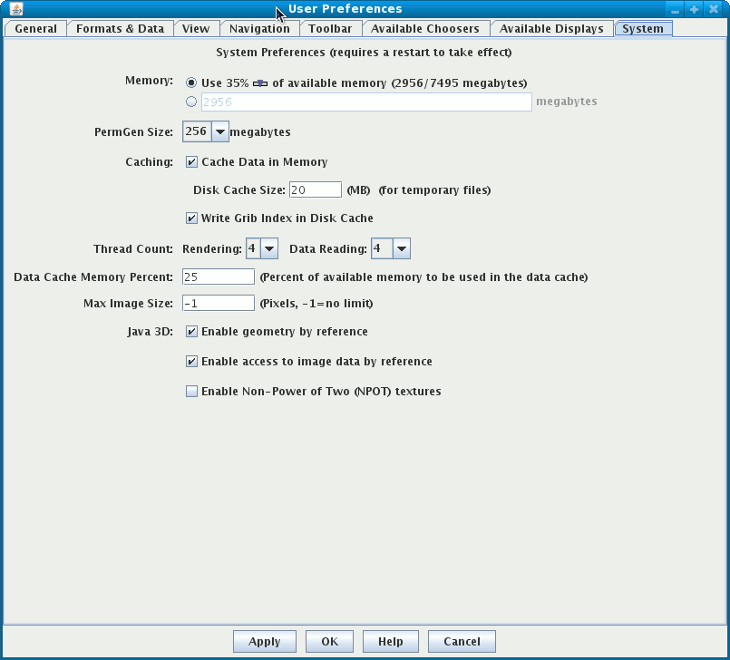
Memory. You can set the amount of memory allocated to the IDV as a percentage of the total system memory or a specific amount (in megabytes). On 32-bit systems, the maximum is 1.5 gigabytes (1500 MB).
Cache Data in Memory. The IDV normally tries to cache data that it loads in memory. You can turn this behavior off with a preference.
Disk Cache Size. The IDV will cache some data sets to disk to eliminate network latency. Specify the maximum amount of disk size with this preference.
Write Grib Index in Disk Cache. The IDV will normally cache grib data index sets to disk in the default directory: .unidata/idv/DefaultIdv/tmp/nj22. If you uncheck this box, the IDV will save those index sets to the same directory as the grib datasets. When you make the change, you need to restart the IDV for this change to take effect, and you need to make sure the write permission on this data directory.
Thread Count. The IDV can do processing in multiple threads. This allows one to take advantage of mulitple core chip architectures. One can set both the thread count for rendering and for data reading. For rendering, each time step for each display is rendered separately. We suggest that for rendering running with 2 threads is optimal. We have not seen large improvements with a higher number of threads (due to memory issues). Also, it is easy to exceed the maximum memory amount if one is rendering in a large number of threads.
The data reading thread count is how many parallel reads (e.g., per time step) there are when accessing data on remote servers (e.g., THREDDS/OpenDAP, ADDE). There is no optimal thread count for data reading because it depends on the configuration of the server machine. We have found that 4 works well.
Max Image Size. This field allows you to set a maximum image size (in pixels) that is to be displayed. When this preference is set the image display will adjust the Pixel Sampling to reduce the image to less than the preferred value. This allows for the initial display of large images without causing memory issues.
Java 3D. These preferences control some Java 3D settings that reduce memory usage when checked.