- If you have not already done so, use the
Edit→Remove All Displaysmenu to remove the displays created in the previous exercise. Set the viewpoint to the top. - In the
Field Selector'sData Sourcespanel, select theNCEP Model Data ETA data sourcethat you loaded in during the previous exercise. - In the
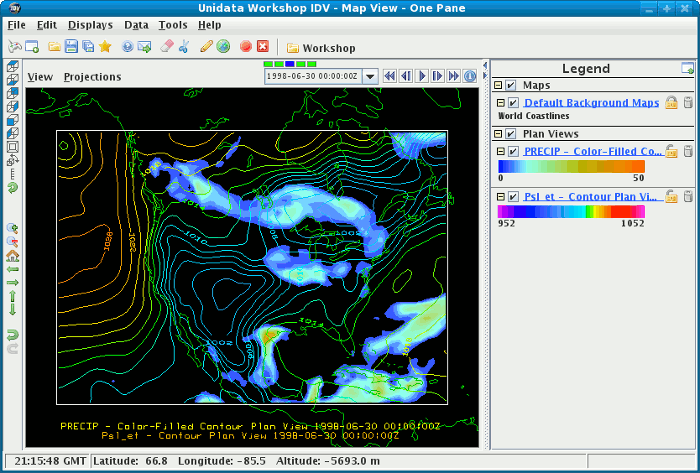
Fieldspanel, expand the2D gridtab. Select themean sea level pressure (ETA model reduction)field. - In the
Displayspanel, selectContour Plan Viewthen click theCreate Displaybutton. The data will be read from the remote server and displayed in the main map window of the IDV. - From the control window for this display, you can change
the contour interval. Click the
Changebutton next to the Contour: label to open theContour Properties Editor. In the editor, change the contour interval to 2 and click theOKbutton.
- In the
Field Selector'sFieldspanel, select thetotal precipitation over accumulation intervalfield. - In the
Displayspanel of theField Selector, selectColor-Filled Contour Plan Viewand then click theCreate Displaybutton. - Since this is a display of precip over an accumulation interval, there will be no display for the first time period of the model. To see the display for subsequent times, start the animation.
- Stop the animation and return the display back to the first time in the sequence.

- In the
Fieldspanel, expand the3D gridtab. Select thegeopotential heightfield. - In the
Displayspanel, selectContour Plan View. - In the
Data Subsetpanel, selectLeveltab and select the500 hectopascallevel then click theCreate Displaybutton. - Start the animation.
- From the control window for this display, change the level
to 250 hectopascals using
Levelsselector. - Rotate the display to see that the level you selected is displayed
above the surface parameters.

- Try other levels and notice how the pattern and position changes.
- Stop the animation and return the display back to the first time in the sequence and reset to the overhead view.


