


The IDV Level 2 radar grid display reads radial parameters from the Level 2 volume scan dataset and automatically generates 3D Cartesian grid parameters. The Integrated Data Viewer (IDV) employs an 8-point weighted interpolation method for this purpose. Efficient search algorithms are utilized to identify the 8 potential valid numbers of data points from 4 available surrounding rays. The resultant 3D Cartesian grid parameters can be showcased through various visualization techniques such as volume rendering, iso-surface representation, cross-sectional display, and plan-view presentations.
If necessary, select Level II data and times as described in Accessing WSR-88D Level II Radar Data.
Edit→Remove All Displays menu item or the
 icon in the toolbar to clear them out.
Data Source Properties editor for Level II Radar Data (DVN).

Times tab,
select 1998-06-29 14:06:21Z time.OK button.
Level II Radar (KDVN)
appears in the Data Sources list in the
Field Selector.
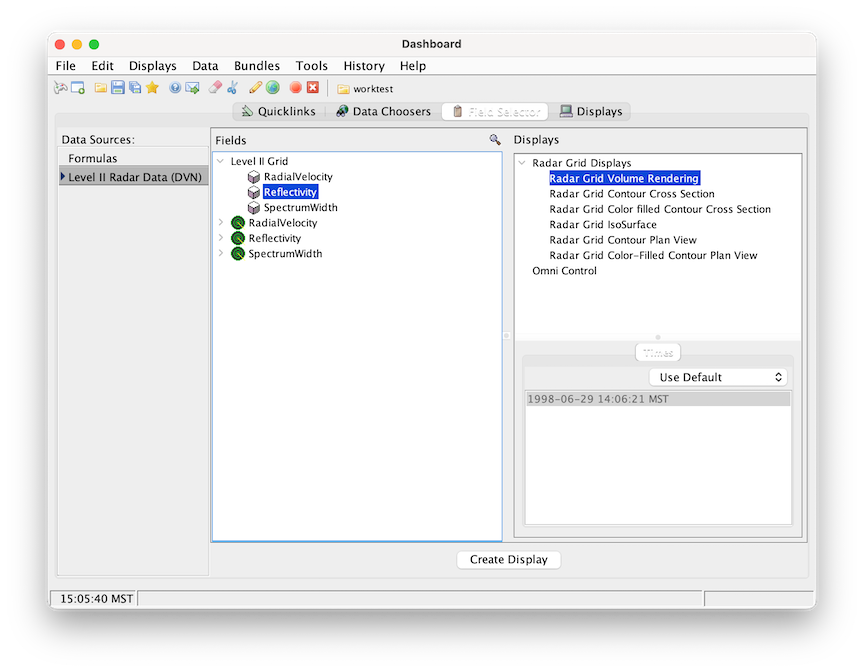
Fields window, there is a list of radar parameters under
the tab Level II Grid.
Reflectivity field, the list of displays that are
applicable to this field are Volume Rendering, Cross Section, IsoSurface, and Plan View displays.
Displays window select a
Radar Grid Volume Rendering display and create a display.
Reflectivity appears in the main window.
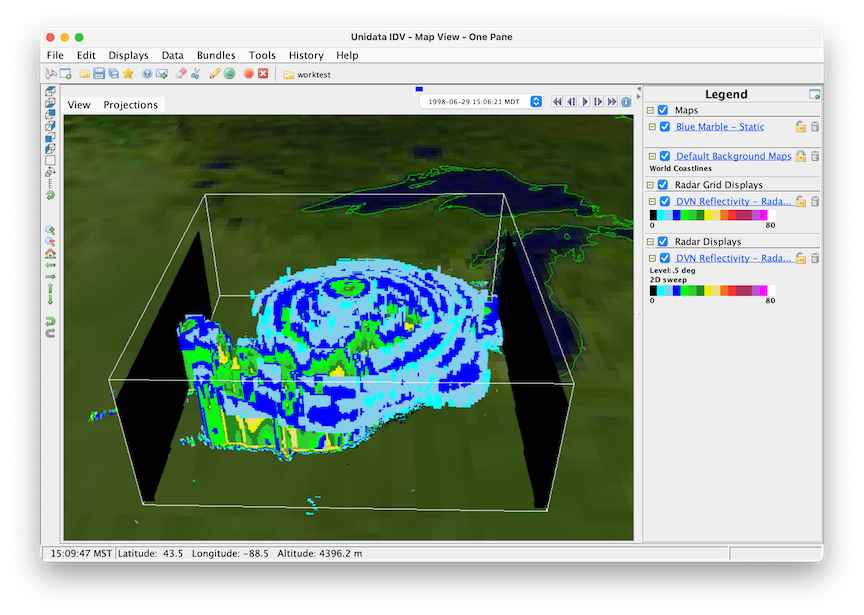
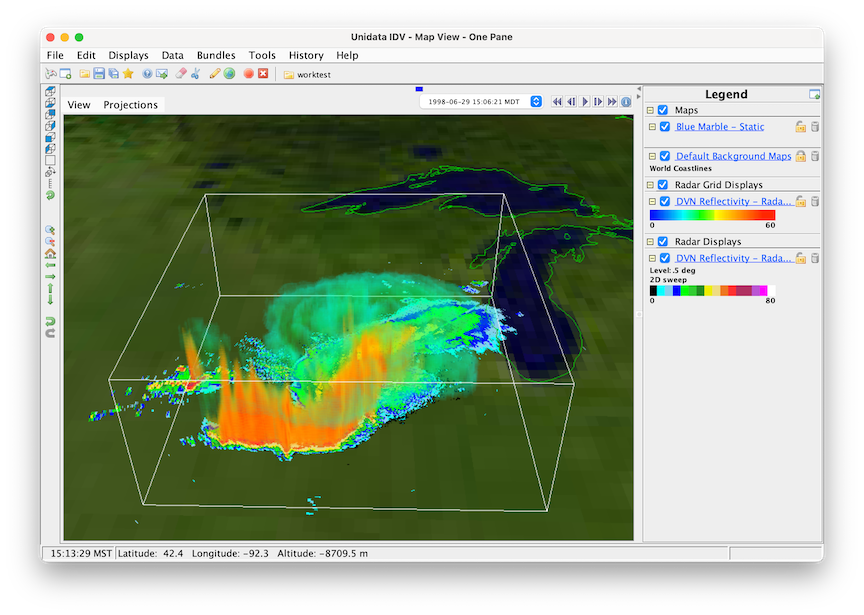
In this display, each grid point's value is represented by a single pixel, colored according to its value. Since the 3D grid fields are solid images, it requires a level of transparency. You can edit the color table or choose a semi-transparent color table by clicking on the color bar to initiate the Color Table Editor. This drop down menu also enables you to modify the range, select other color tables in the category of "Transparent," and make necessary adjustments.
VolumeRendering display and
adjust the Resolution to increase or decrease the number of the grid points in
the main display.
Smoothing algorithms to
the display.